Sentinel 1 Change Detection for Forest Monitoring
Last week, I was trying to build a forest monitoring system using Sentinel-1 data. The idea of using radar data instead of optical data is that the climate of most tropical forest areas in the world is characterized by frequent and persistent rainfall, so the cloud cover tends to be high throughout the year. For example, the Hansen deforestation dataset is a very good-quality global deforestation dataset built using Landsat optical satellite data. The dataset is annual from 2000 to 2023 (last time I checked). I can imagine it would be very hard, and even impossible in some parts of the world, to build a monthly deforestation layer using the same approach due to cloud cover. Unlike optical sensor, radar signal have the ability to penetrate colud cover, making it a more reliable for monitoring in high cloud cover areas.
The Sentinel-1 forest monitoring system I built is based on change detection at its core. It simply involves subtracting images from \(\mathbf{t_1}\) and \(\mathbf{t_2}\). However, due to the high noise of radar images and the different atmospheric conditions in \(\mathbf{t_1}\) and \(\mathbf{t_2}\), some care needs to be taken when pre-processing each image. That, and some additional image analysis tricks and magic!
Generally, the steps are as follows:
-
Filtering Sentinel-1 Metadata: We filter the metadata to only get images with identical orbital passes and numbers. Radar images are especially sensitive to viewing geometry, so we need to make sure that the viewing geometry of each image is as similar as possible.
-
Speckle Filtering: We use both spatial and temporal axes to do speckle filtering using a three-dimensional kernel.
-
Additional Normalization and Time-Series Aggregation: These steps help minimize changes that are not related to forest cover change.
-
Forest Mask (ideally): We also need to incorporate a forest mask to remove any changes that are not related to the forest (which I didn’t include this time).
-
Change Detection: Subtracting images in concecutive time periods and applying threshold value to filter out minor changes due to noises.
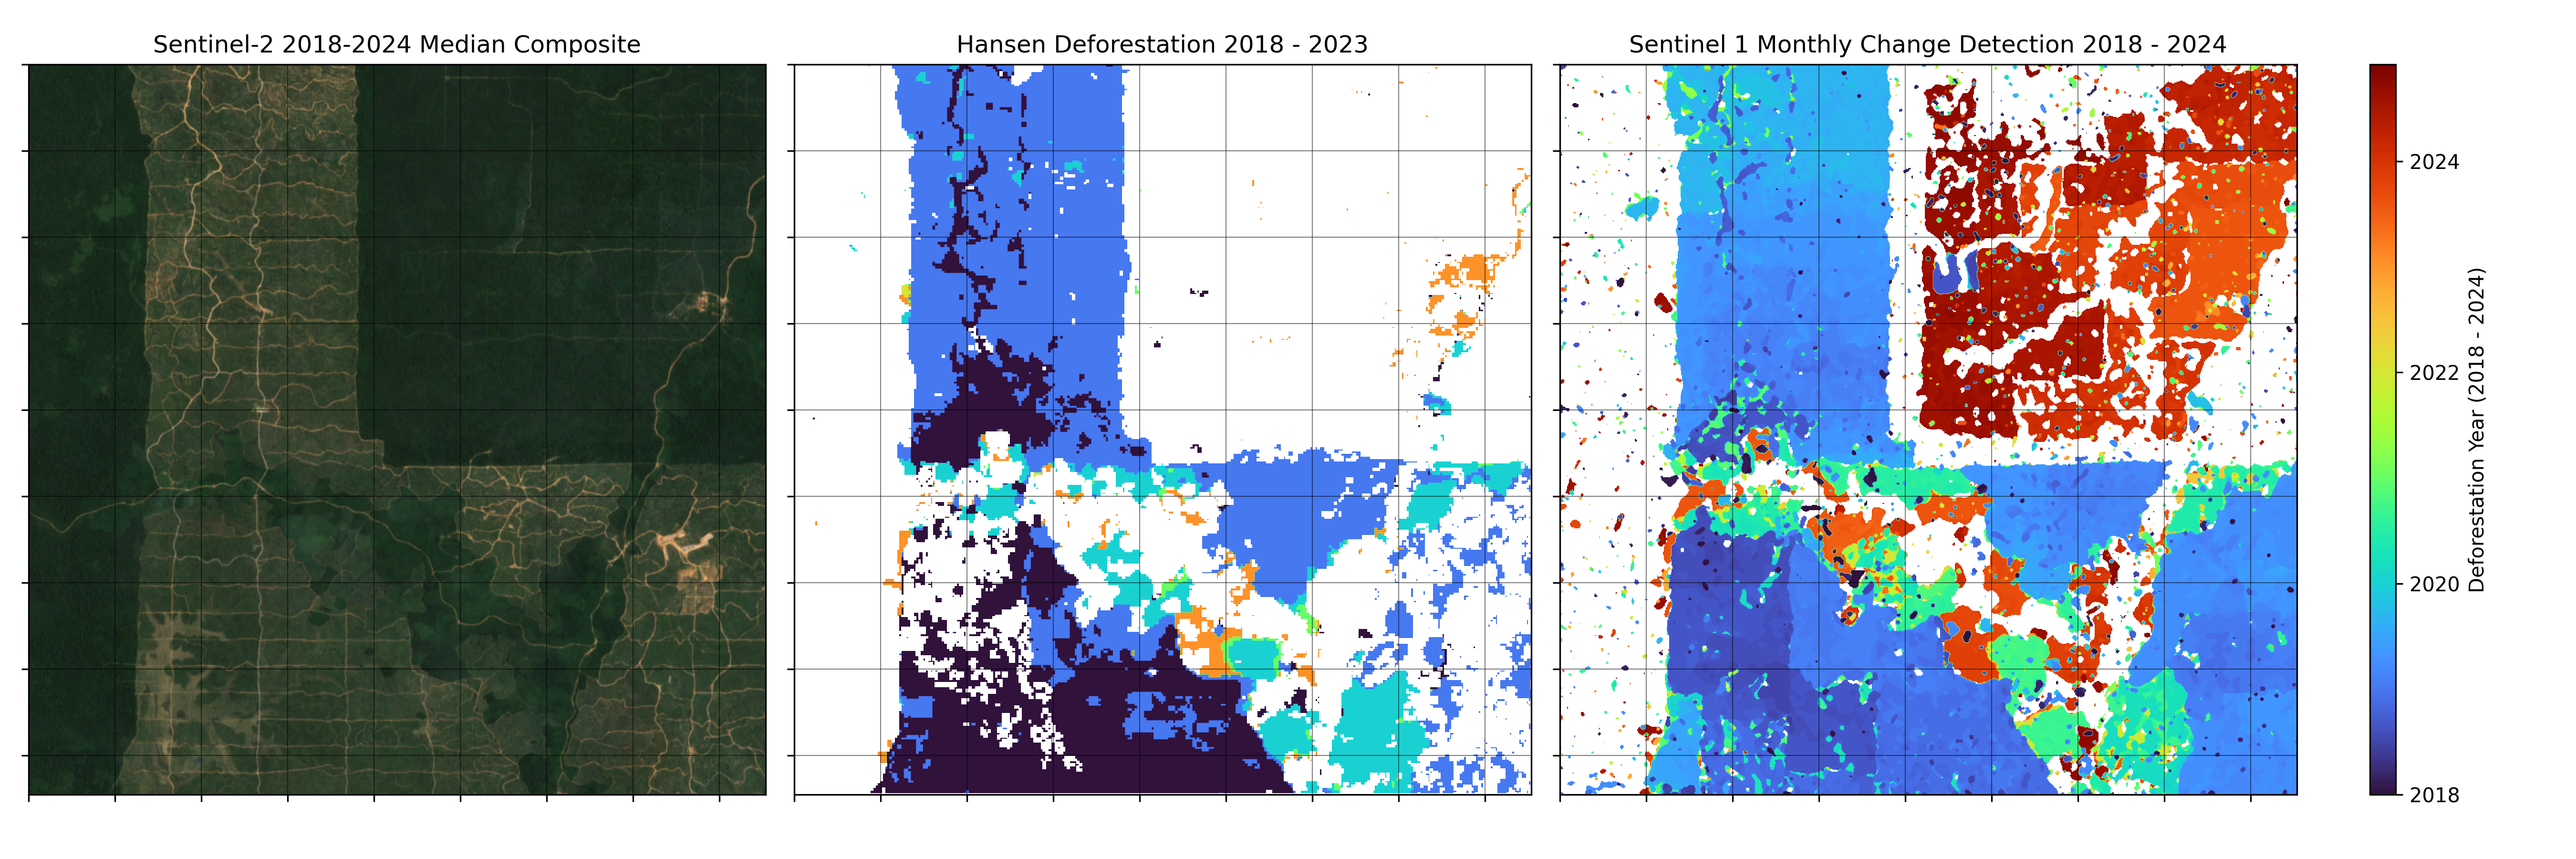
Below are examples of the results of this method compared to the Hansen layer for some forest areas in Borneo, which have been converted into palm oil plantations.

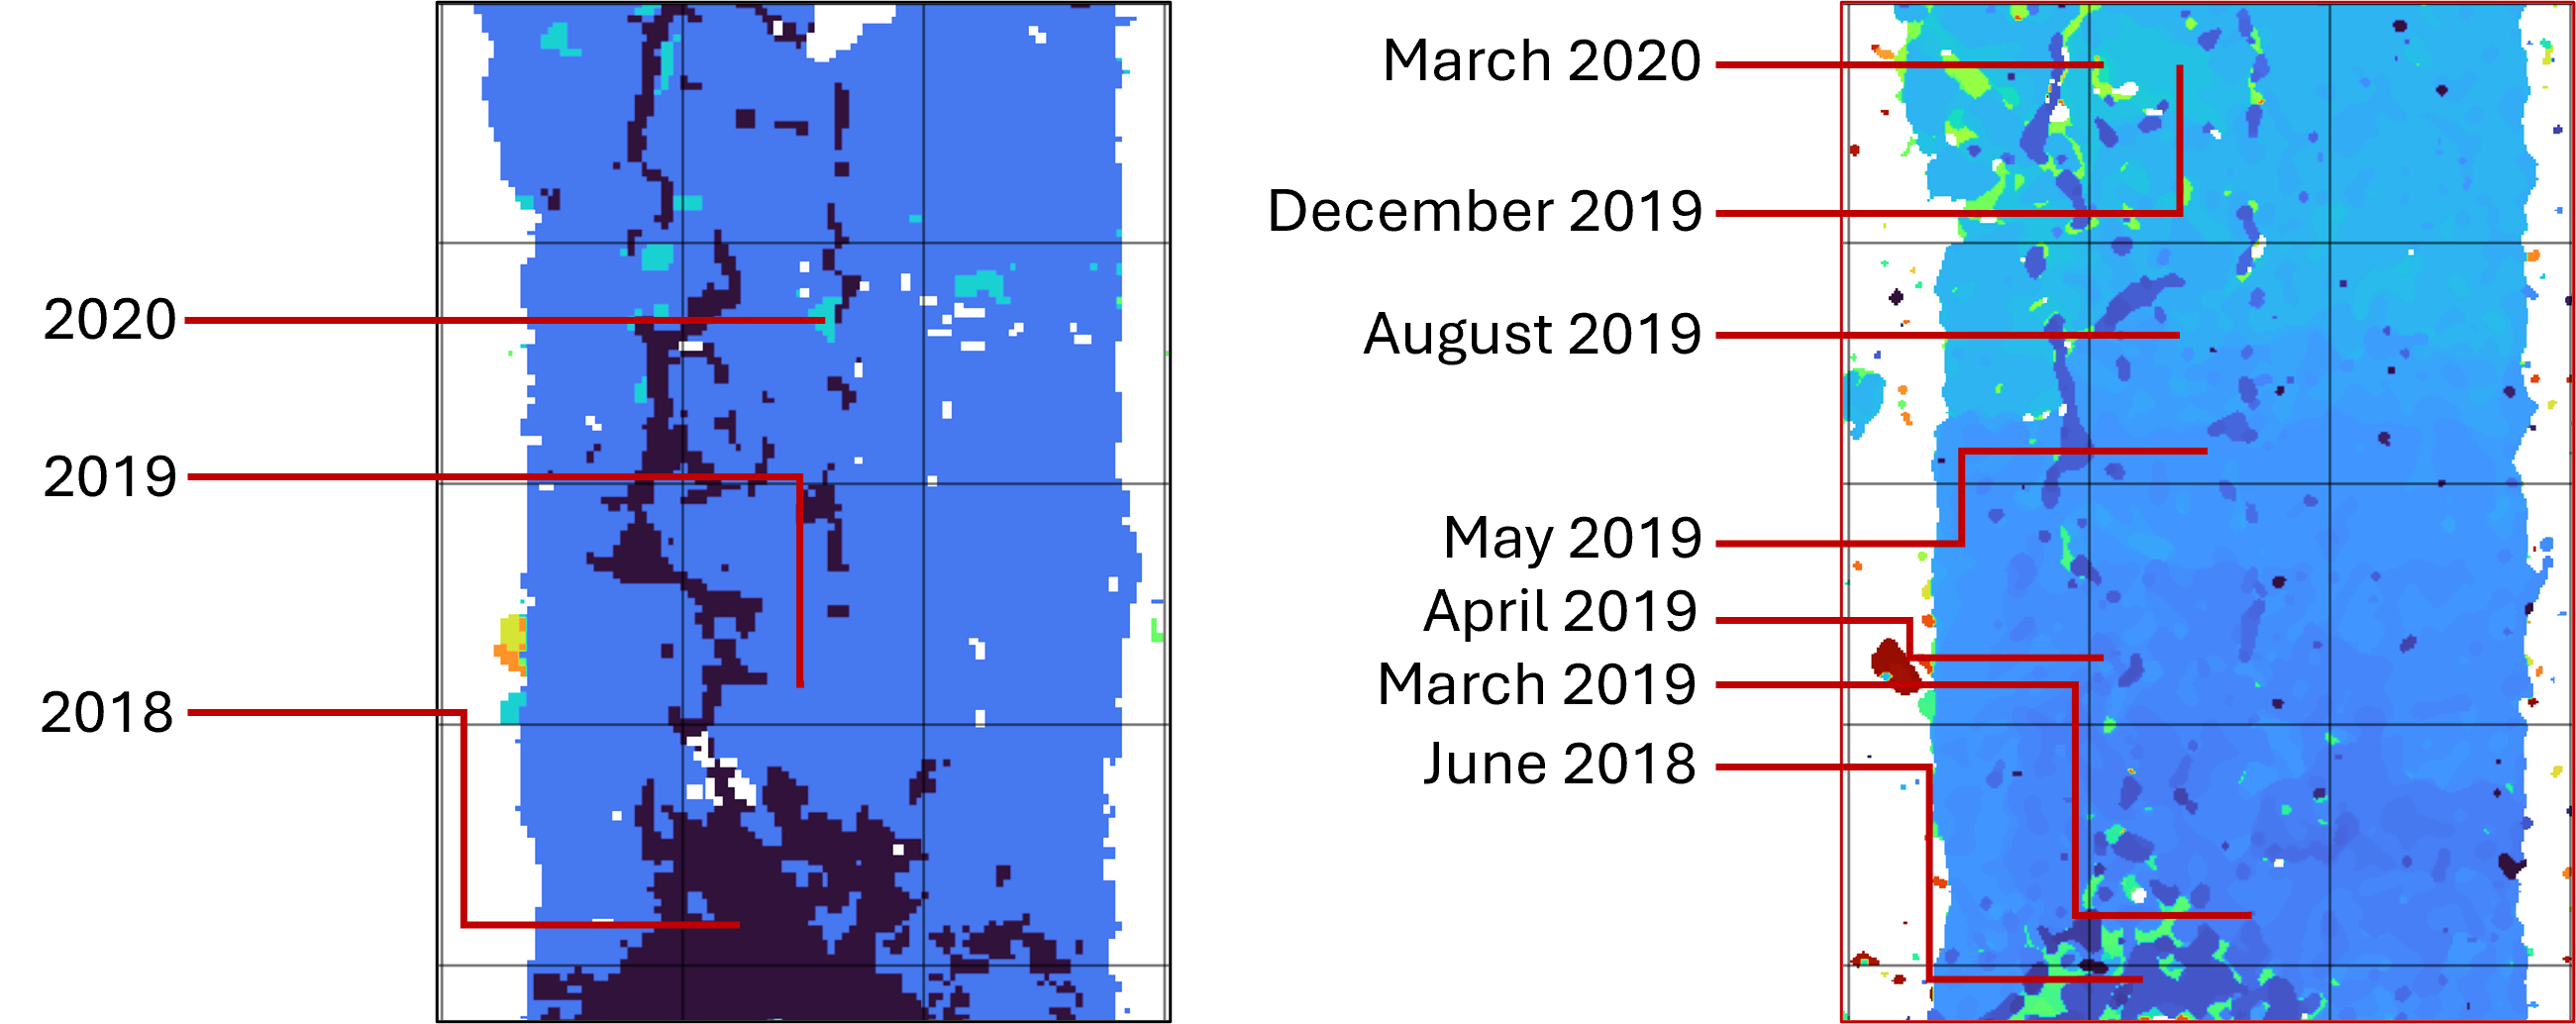
The main difference between the two results is the big patch of deforestation in the top-right layer, which was not recorded in the Hansen layer. The Hansen dataset I acquired from Earth Engine only goes up to 2023, and those deforestations are happening in 2024. The most important difference, of course, is the time frequency. My approach records monthly changes, so if we zoom into the top-left patch of the image as an example, we can see the detail of the deforestation progression throughout the months of the year. In this particular case, the palm oil plantation seems to expanded towards the north with pace of 50 Ha/month for a time period of 22 months from June 2018 until March 2020. This example shows the potential of using this type of monthly information to build an early warning system to monitor forest area throughout the globe.

Another potential issue (or maybe a potential feature) of this approach is that, our measurement is essentially a proxy for forest canopy density change. This means it is not only sensitive to deforestation but also to disturbance. Unfortunately, without ground truth, it is difficult to make sure whether these patches are indeed related to actual disturbance events or an artifact of sensor noise. My best bet is that it is currently the combination of both. If we want to exclude these small changese patches we can adjust the threshold, and add aditional post-processing step such as majority kernel. It is very difficult to find an optimum threshold for a very large area (i.e. the whole planet) so some trade-off decision need to be made.
Note: There are similar datasets that also use Sentinel-1 to monitor forest changes monthly, such as RADD Alerts. I compared my result with RADD Alerts, and it produced almost identical results. The advantage of using your own method instead of relying on an existing global dataset is the flexibility to adjust parameters if necessary.
Enjoy Reading This Article?
Here are some more articles you might like to read next: