Testing Sentinel-2 Super Resolution Using S2DR3
Super-resolution generally refers to methods that increase the spatial resolution of an image using lower-resolution input. In other words, it’s trying to make the pixels smaller so the image looks sharper and more detailed. I’ve always been skeptical with such approach. Even with more conservative approaches like pan-sharpening, you often end up with spectral distortions, especially in longer wavelengths like NIR or SWIR.
When deep learning-based methods started showing up a few years ago, I was even more doubtful with the practical application of these approach. The idea of forcing a computer to “hallucinate” an object otherwise invisible by the sensor didn’t sit well with me. Maybe it’s because I come from a spectral geology background, and I’m used to working with data where spectral integrity really matters. I prefer images to stay as unaltered as possible so they can be analyzed properly.
Lately, I saw a lot of people talking about a new super-resolution model called S2DR3. It seems to get a good response from the remote sensing community. Probably because recently I started to work with a less niche application of remote sensing, I start to be more open minded and curious to test what this model can actually do ande decided to give it a try.
The model essentially is a CNN-based deep learning model trained on artificial/synthetic high-resolution multispectral data (not entirely sure how that part was done, and it’s not fully disclosed as far as I can tell). The model takes Sentinel-2 images that have been resampled to 10 meters and produces output with 1 meter resolution. So, basically it turns each pixel into 100 new pixels per band.
I tested it in various locations across Indonesia covering scenes realted with mining, agricultu, and urban areas. I wanted to run a quick test on its spatial and spectral integrity by doing visual comparisons with very high resolution WorldView images and also sampling random points to compare spectra and compute RMSE.
Spatial Integrity by Visual Comparison
Below are a few example scenes: in various different locations. Senitnel-2 image have 10 meters spatial resolution, S2DR3 result have 1 meters spatial resolution, and WorldView image have 30 centimeters spatial reoslution.
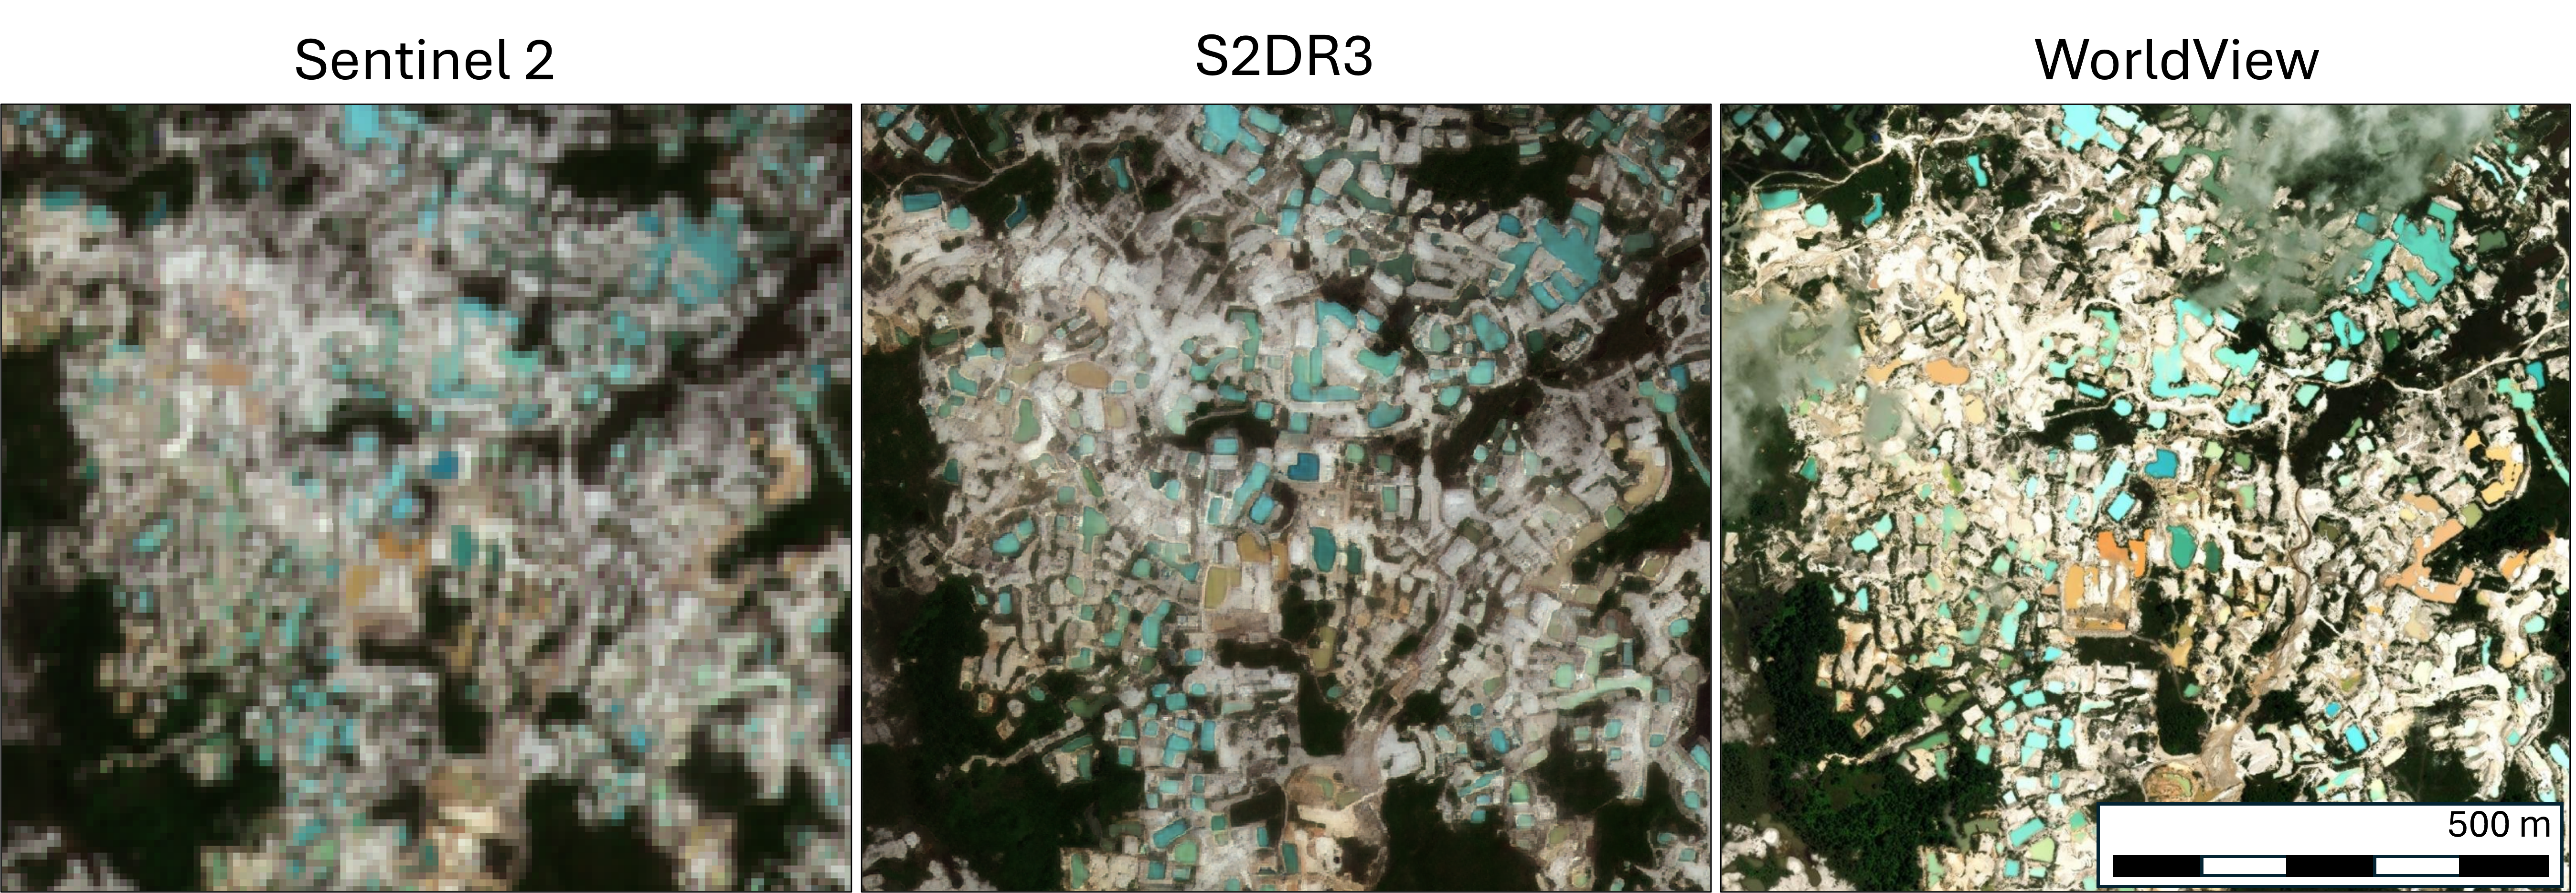
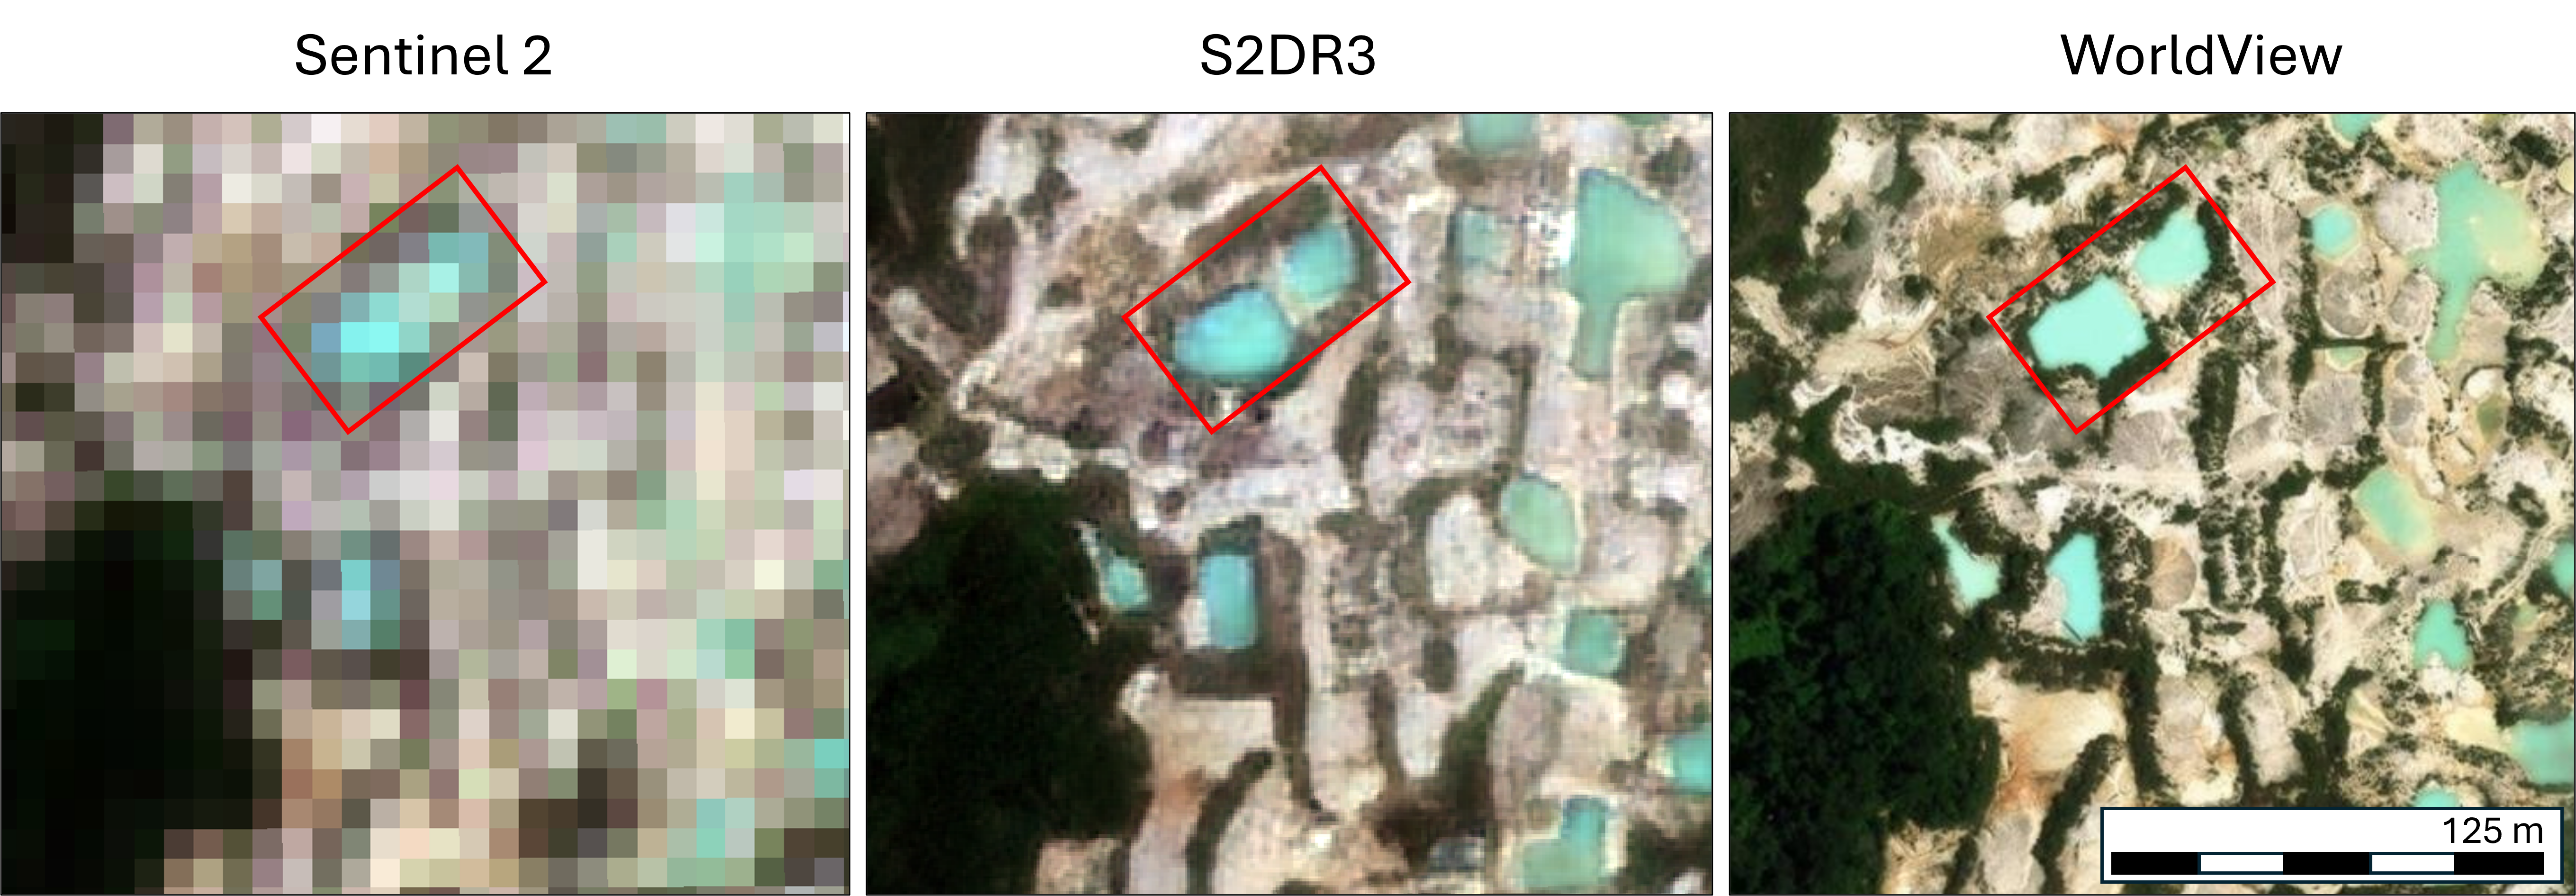
Image 1 and Image 2 shows an illegal gold mining in Central Borneo at different scale. Being able to detect each small pool is important, both for monitoring and for any restoration effort. Spectral information could also help differentiate pools with different physical and chemical properties. I find in this case that S2DR3 provides an excelent result which are able to reasonably match the very high resolution WordlView image. In Image 2, the red box highlights a narrow partition (less than 5 meters) between pools, which the model captures quite accurately.
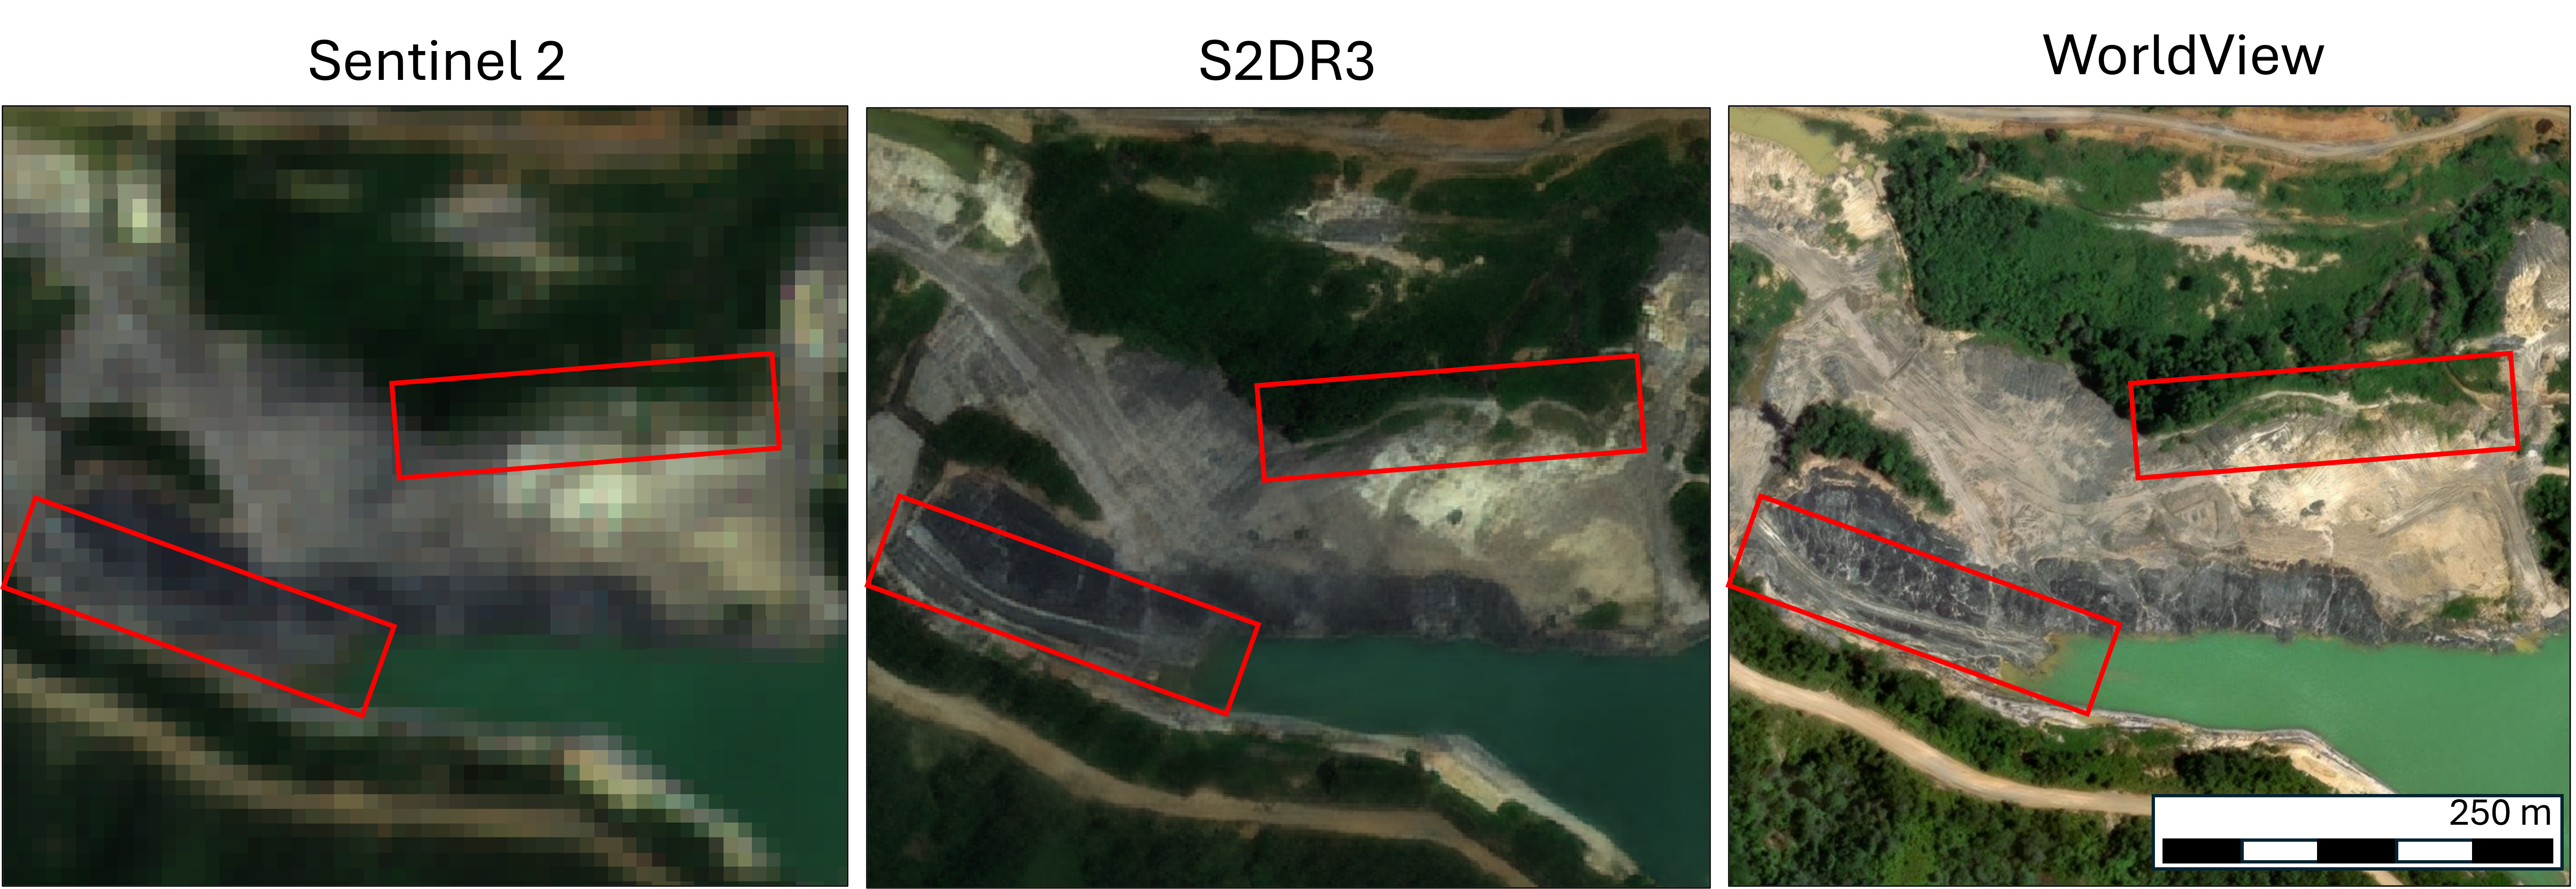
Image 3 shows an active coal mine in East Borneo. The original Sentinel-2 barely shows the mining roads, but in the S2DR3 result, two main roads become clearly visible. Very useful detail which quite amazingly captured by the model.
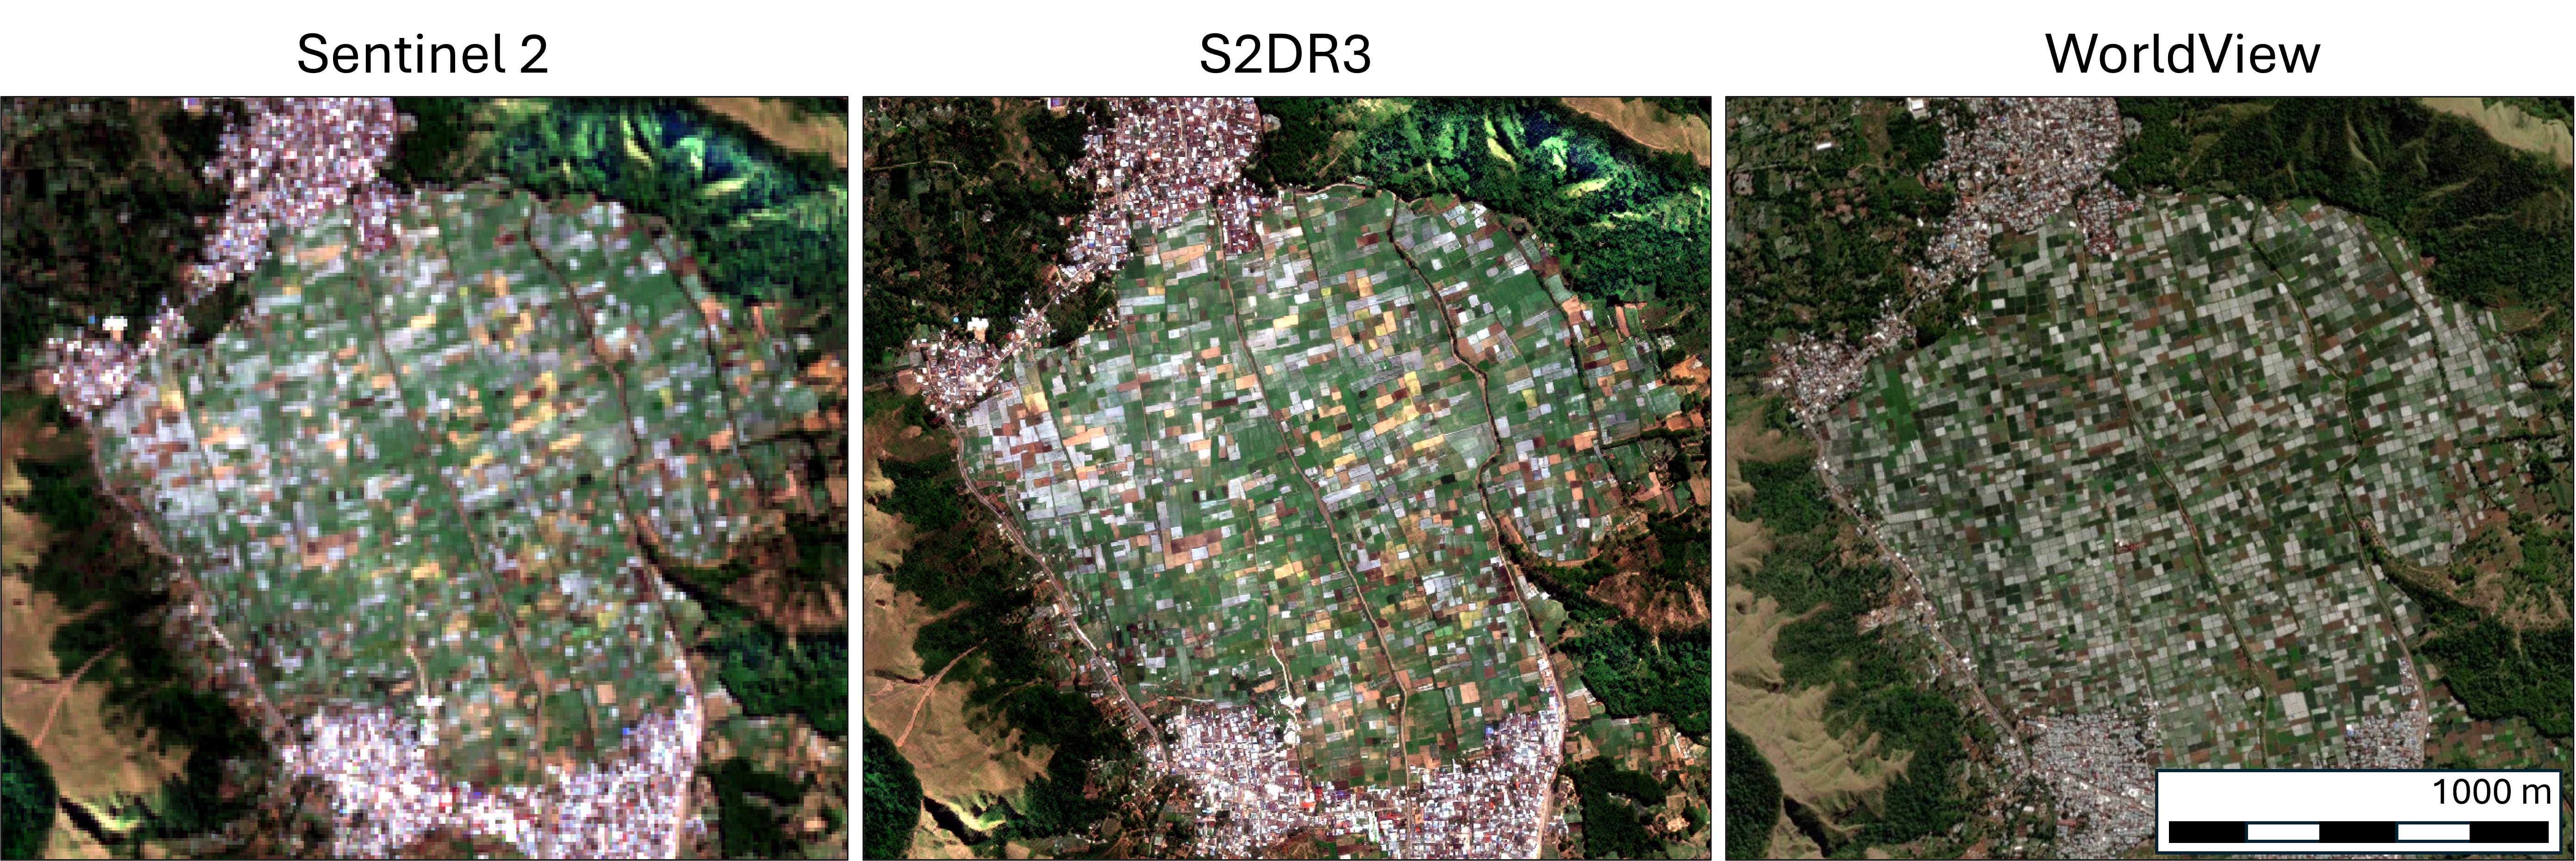
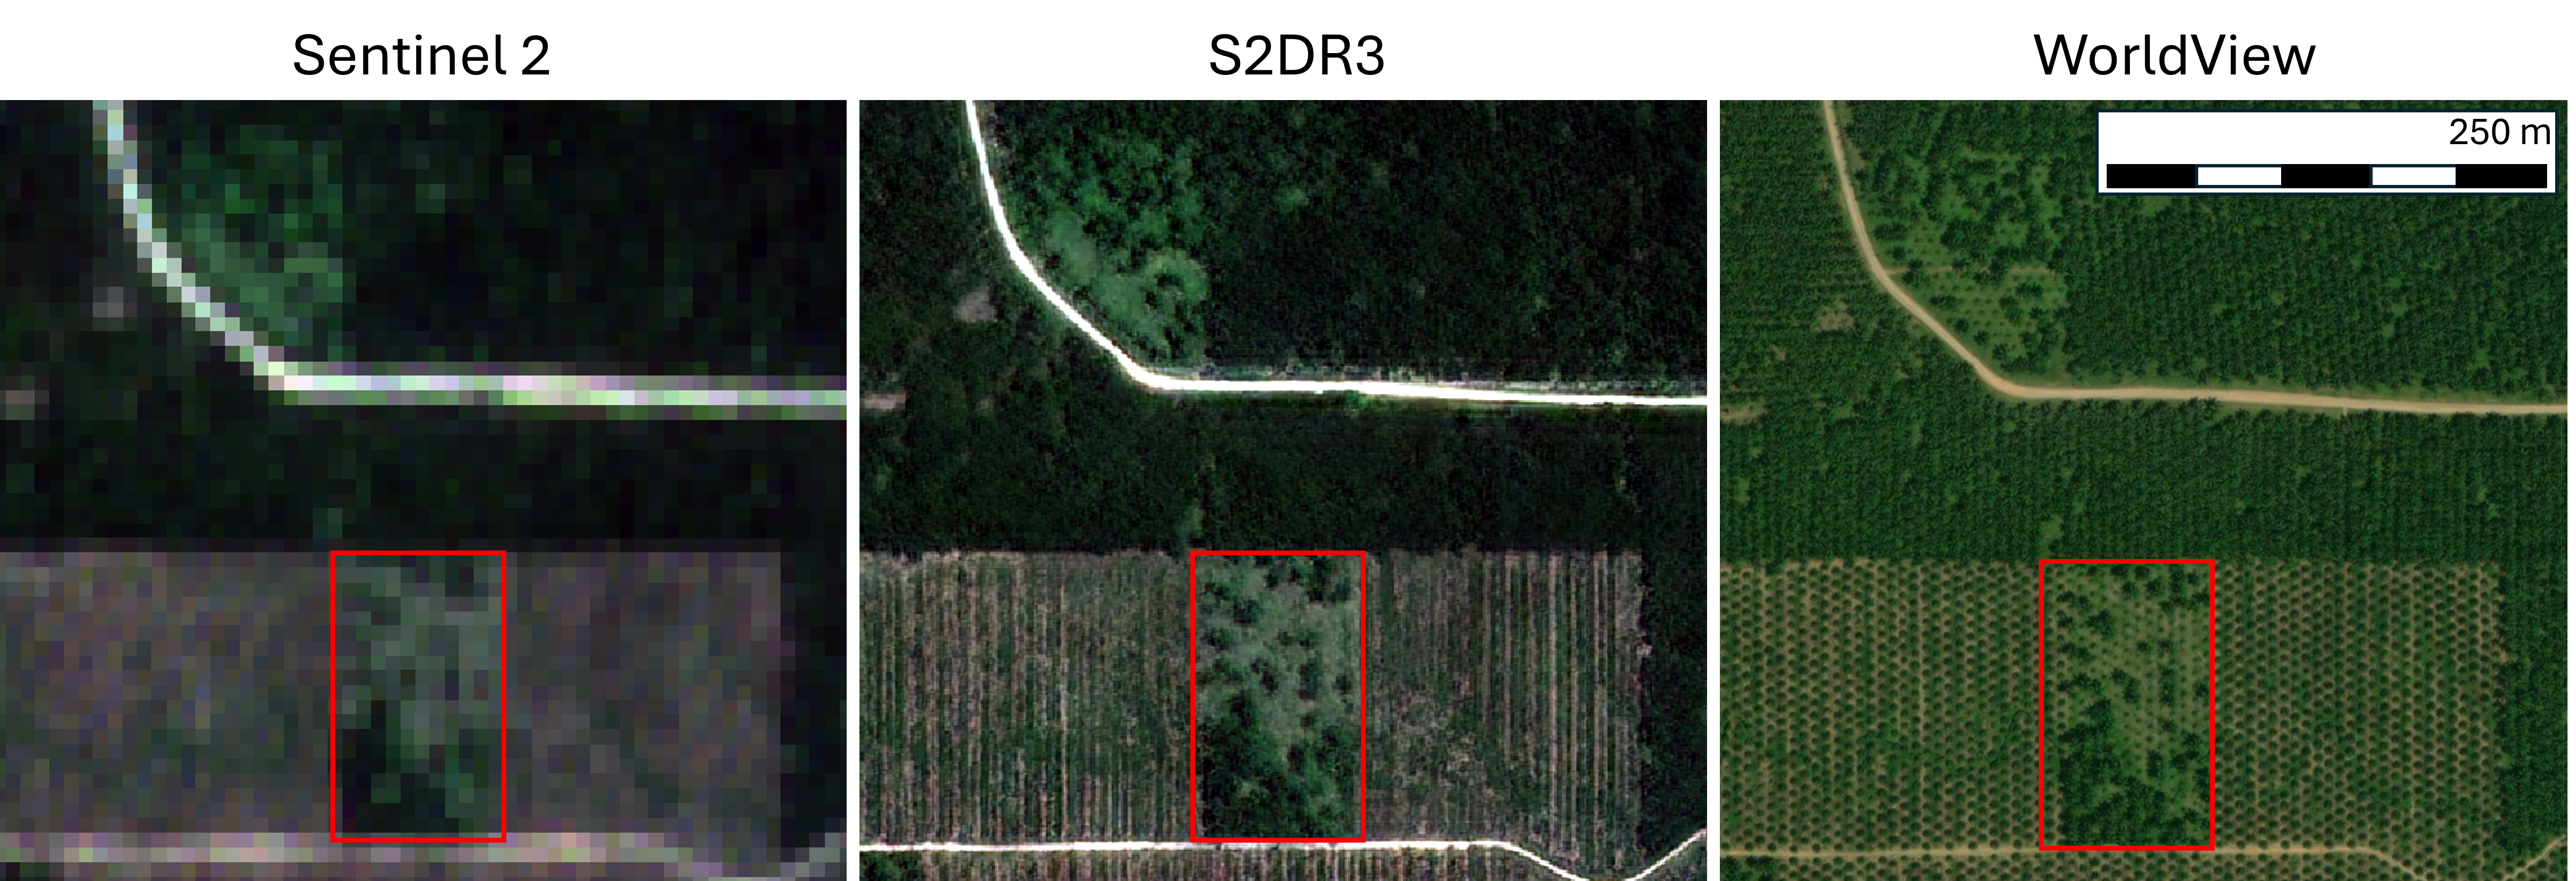
Image 4 and 5 shows examples related with agricultural field. Image 4 shows rice fields in Sembalun where S2DR3 can separate each individual partitions of the rice filed really well. Image 5 shwos an even impressive performance where individual palm canopies in palm plantation in Souhth Sumatera are predicted with good accuracy.
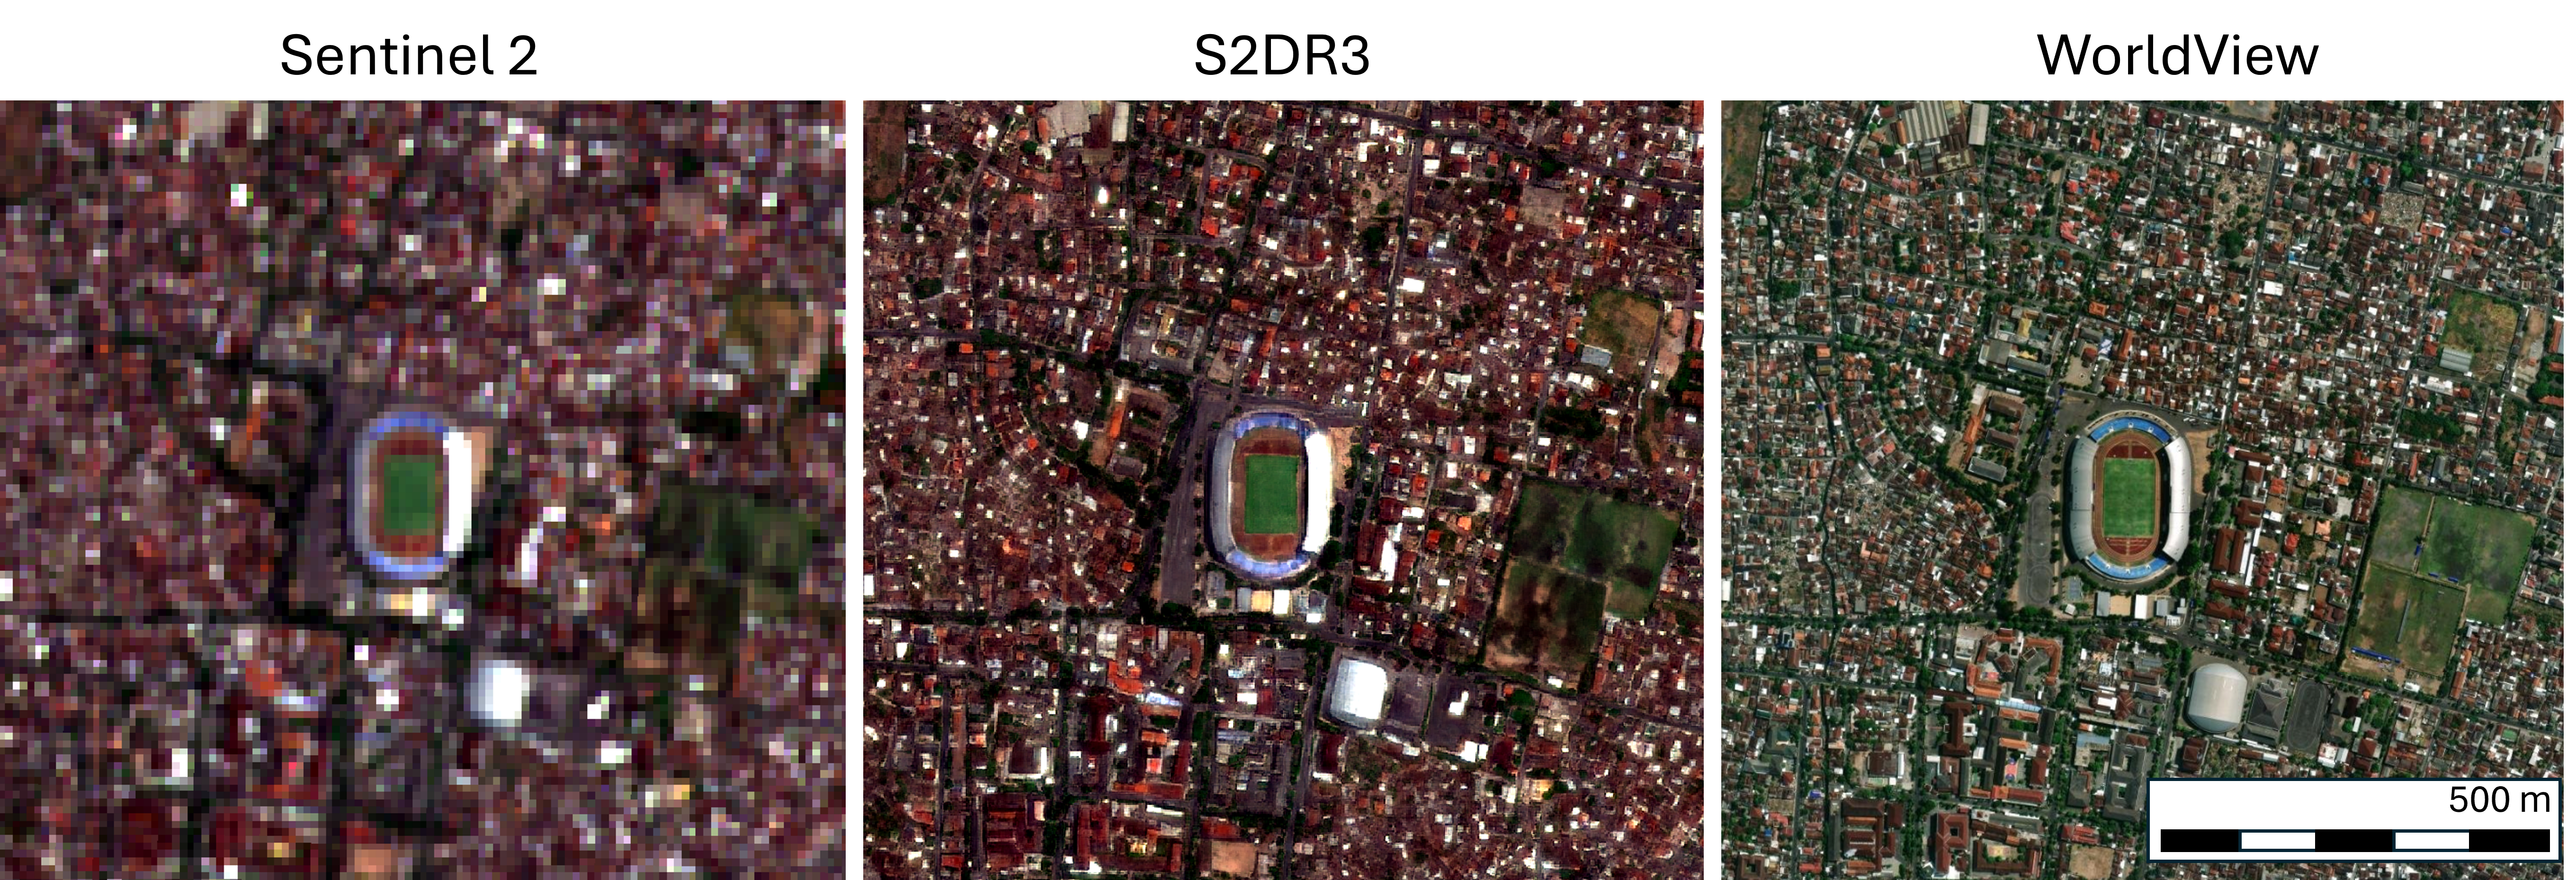
Image 6 shows a dense urban are in the heart of Yogyakarta. This one is more challenging. If you zoom in, S2DR3 tends to merge adjacent buildings with the same roof material. However, bigger building, roads, and small building with different roof material with its surroundings are still reconstructed with shapes close to the original condition.
Spectral Integrity by Random Sample Comparison
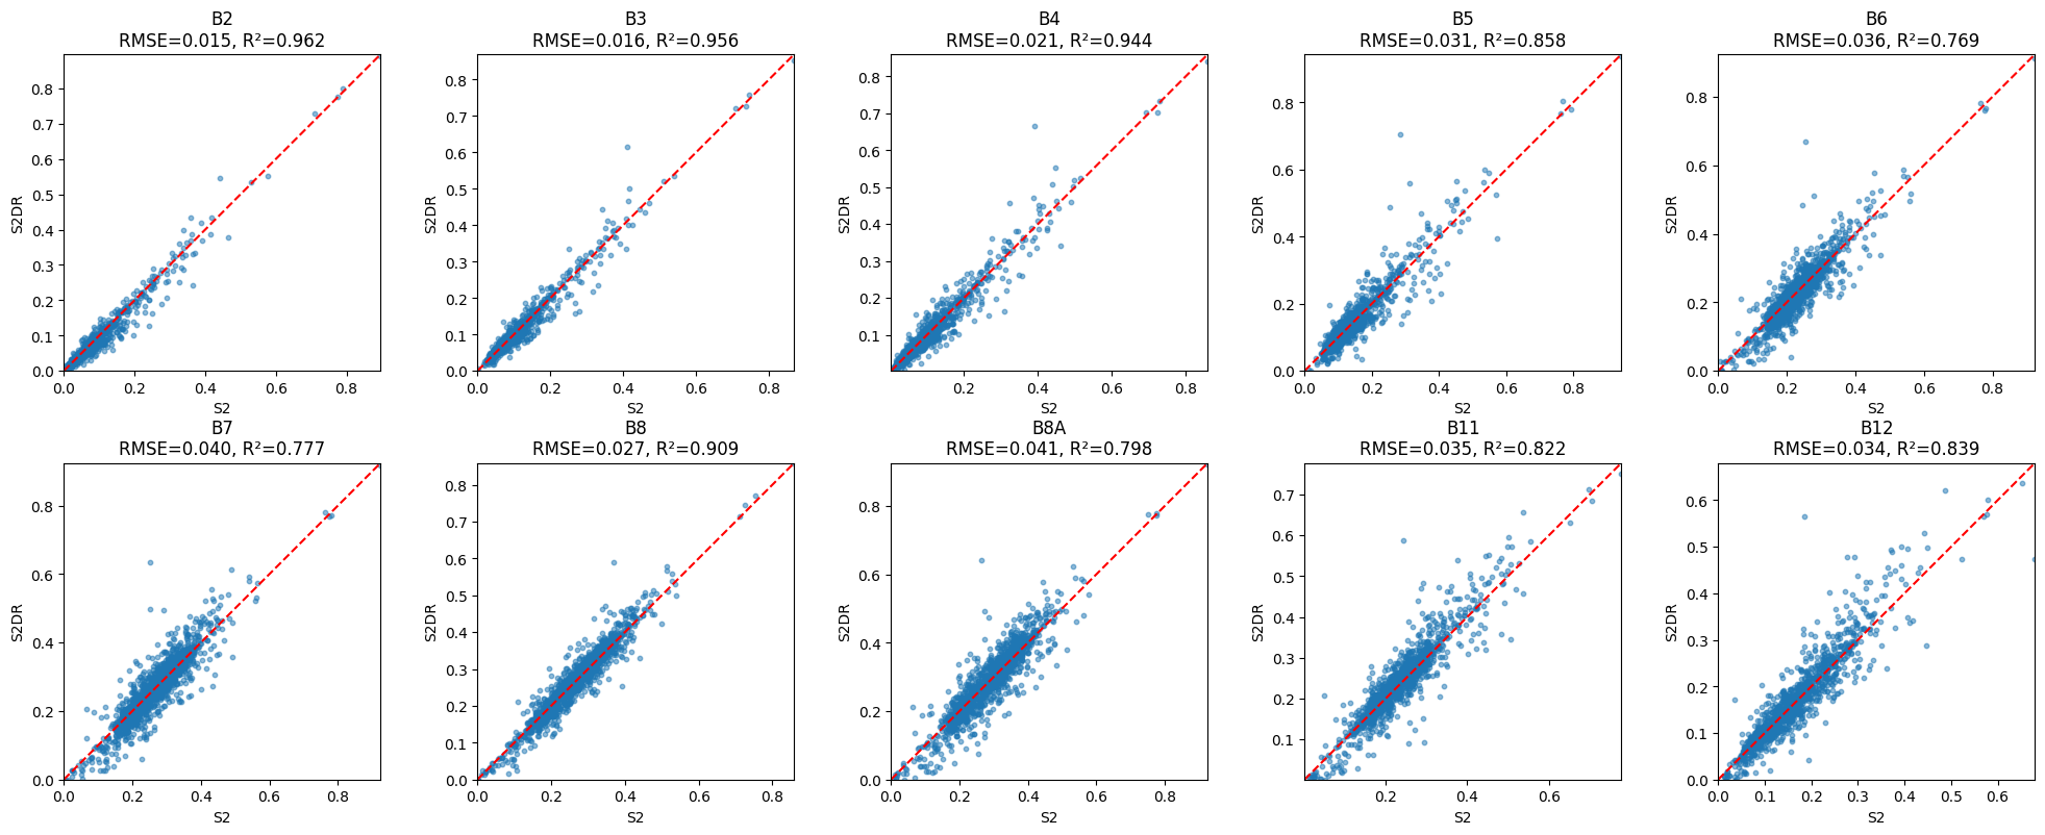
To check spectral performance, I sampled points from each image and compared the original Sentinel-2 spectra with the S2DR3 result. The RMSE plots (Image 7) show that RGB bands hold up better than the longer wavelengths. Probably has to do with how the synthetic high resolution training data was generated. Still, even in the longer wavelengths, the errors aren’t too bad. For many use cases, the results might be good enough.
Final Thoughts
Honestly I am really impressed. This feels like magic, or cheating reality. In any case, when using this model, it is important not to confuse the result with real 1-meter data. Think of it more like an intelligent interpolation. The model has learned spatial and spectral patterns from a massive dataset and able to execute something like a context aware non-linear interpolation of the input data with acceptable error. So far I haven’t seen anything that looks like an absurd hallucination out of the model, but we should stay cautious and interpret the results critically, especially if we’re using them for any decision-making.
I am quite optimistic that this is a useful model for a range of agricultural and environmental applications. Tasks like detecting small ponds, informal roads, crop plots, or even estimating canopy cover could benefit from the extra spatial detail. I wonder how far we are until we get the same model for hyperspectral images 👀.
If you’re working with Sentinel-2 images, I strongly recommend checking out more examples and one of the authors’ articles. Try the model yourself and see how it performs in your use case.
Enjoy Reading This Article?
Here are some more articles you might like to read next: