Spatio-Temporal Analysis of Industrial and Artisinal Offshore Tin Mining Vessel
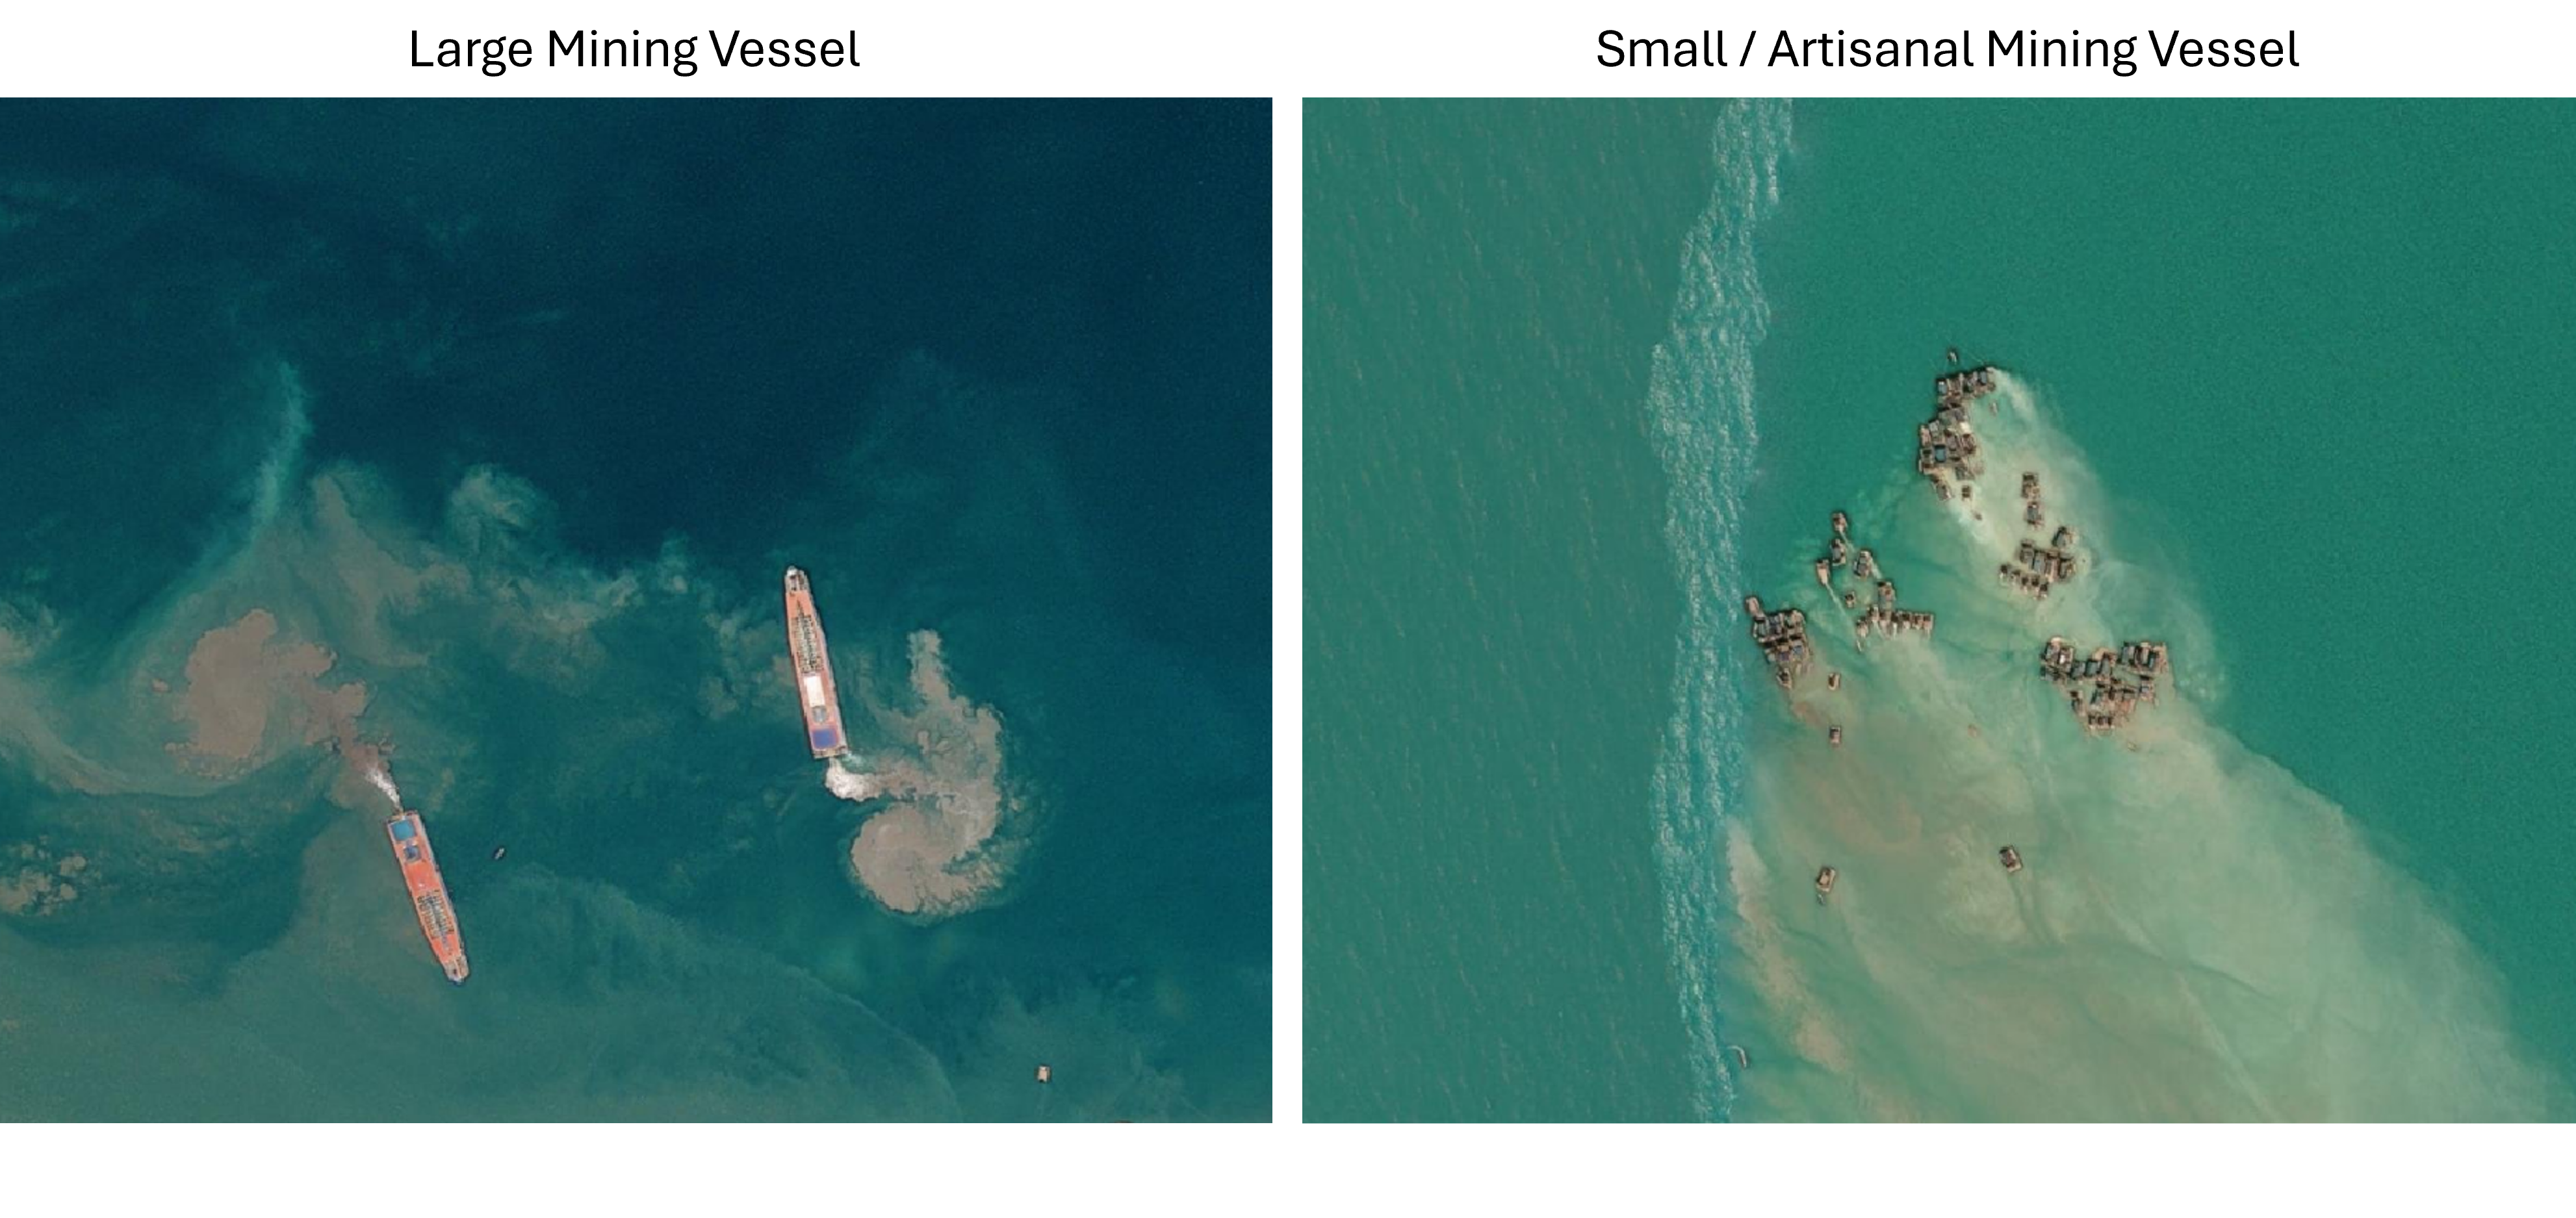
Most of the tin sold on the international market comes from a small island in Indonesia called Bangka. What’s less known is that a significant amount of that tin is mined offshore. There are two types of vessels commonly involved in this activity. Large dredger vessels, typically 50 to 120 meters in length, are operated by formal mining companies at industrial scale. At the same time, there are smaller artisanal boats—usually no more than 10 meters long—using simple suction pumps handled by divers and connected to traditional sluice boxes onboard. The later are typically related with illegal mining activities.
Ship Detection and Classification
To better understand how offshore mining activity changes over time, I’ve been developing a ship detection algorithm tailored to this region. I use Sentinel-1 SAR data, which is particularly suitable for this task. Not only can it see through the frequent cloud cover over the shores of Bangka, but it also does a good job of capturing the contrast between open water and floating objects—even relatively small ones.
For this study, I focused on the eastern part of Bangka Island.
Before doing any detection, I needed a good quality ‘ground truth’ data. In this case that meant finding scenes where Sentinel-1 and Sentinel-2 images—or ideally very high-resolution optical images—were available on the same date. This allows for visual confirmation of vessel types and ensures that the training data is as accurate as possible.

After collecting a good number of examples, I started looking into how the SAR sensor responds to the different types of vessels. It turns out that their radar signatures are quite distinct, especially when you compare the VV and VH polarizations of Sentinel-1.
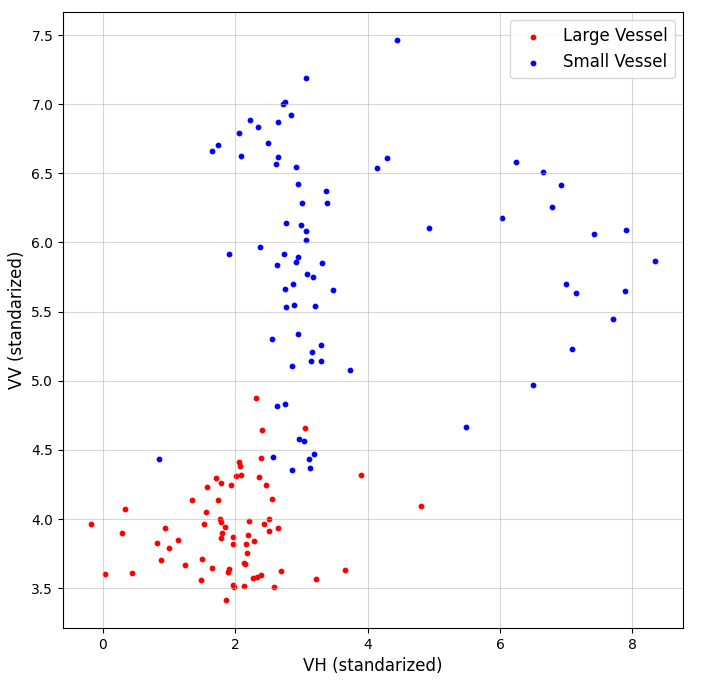
The differences in backscatter likely relate to both the size of the vessels and the materials they’re made of. while large mining vessel are made out of metals, the smaller artisinal mining vessel are made out of wood.
For classification, I used an object-based approach. First, I segmented the image, and then applied a support vector machine (SVM) to classify the segmented objects. The training result was promising: a validation accuracy of about 98%.
Results and Analysis
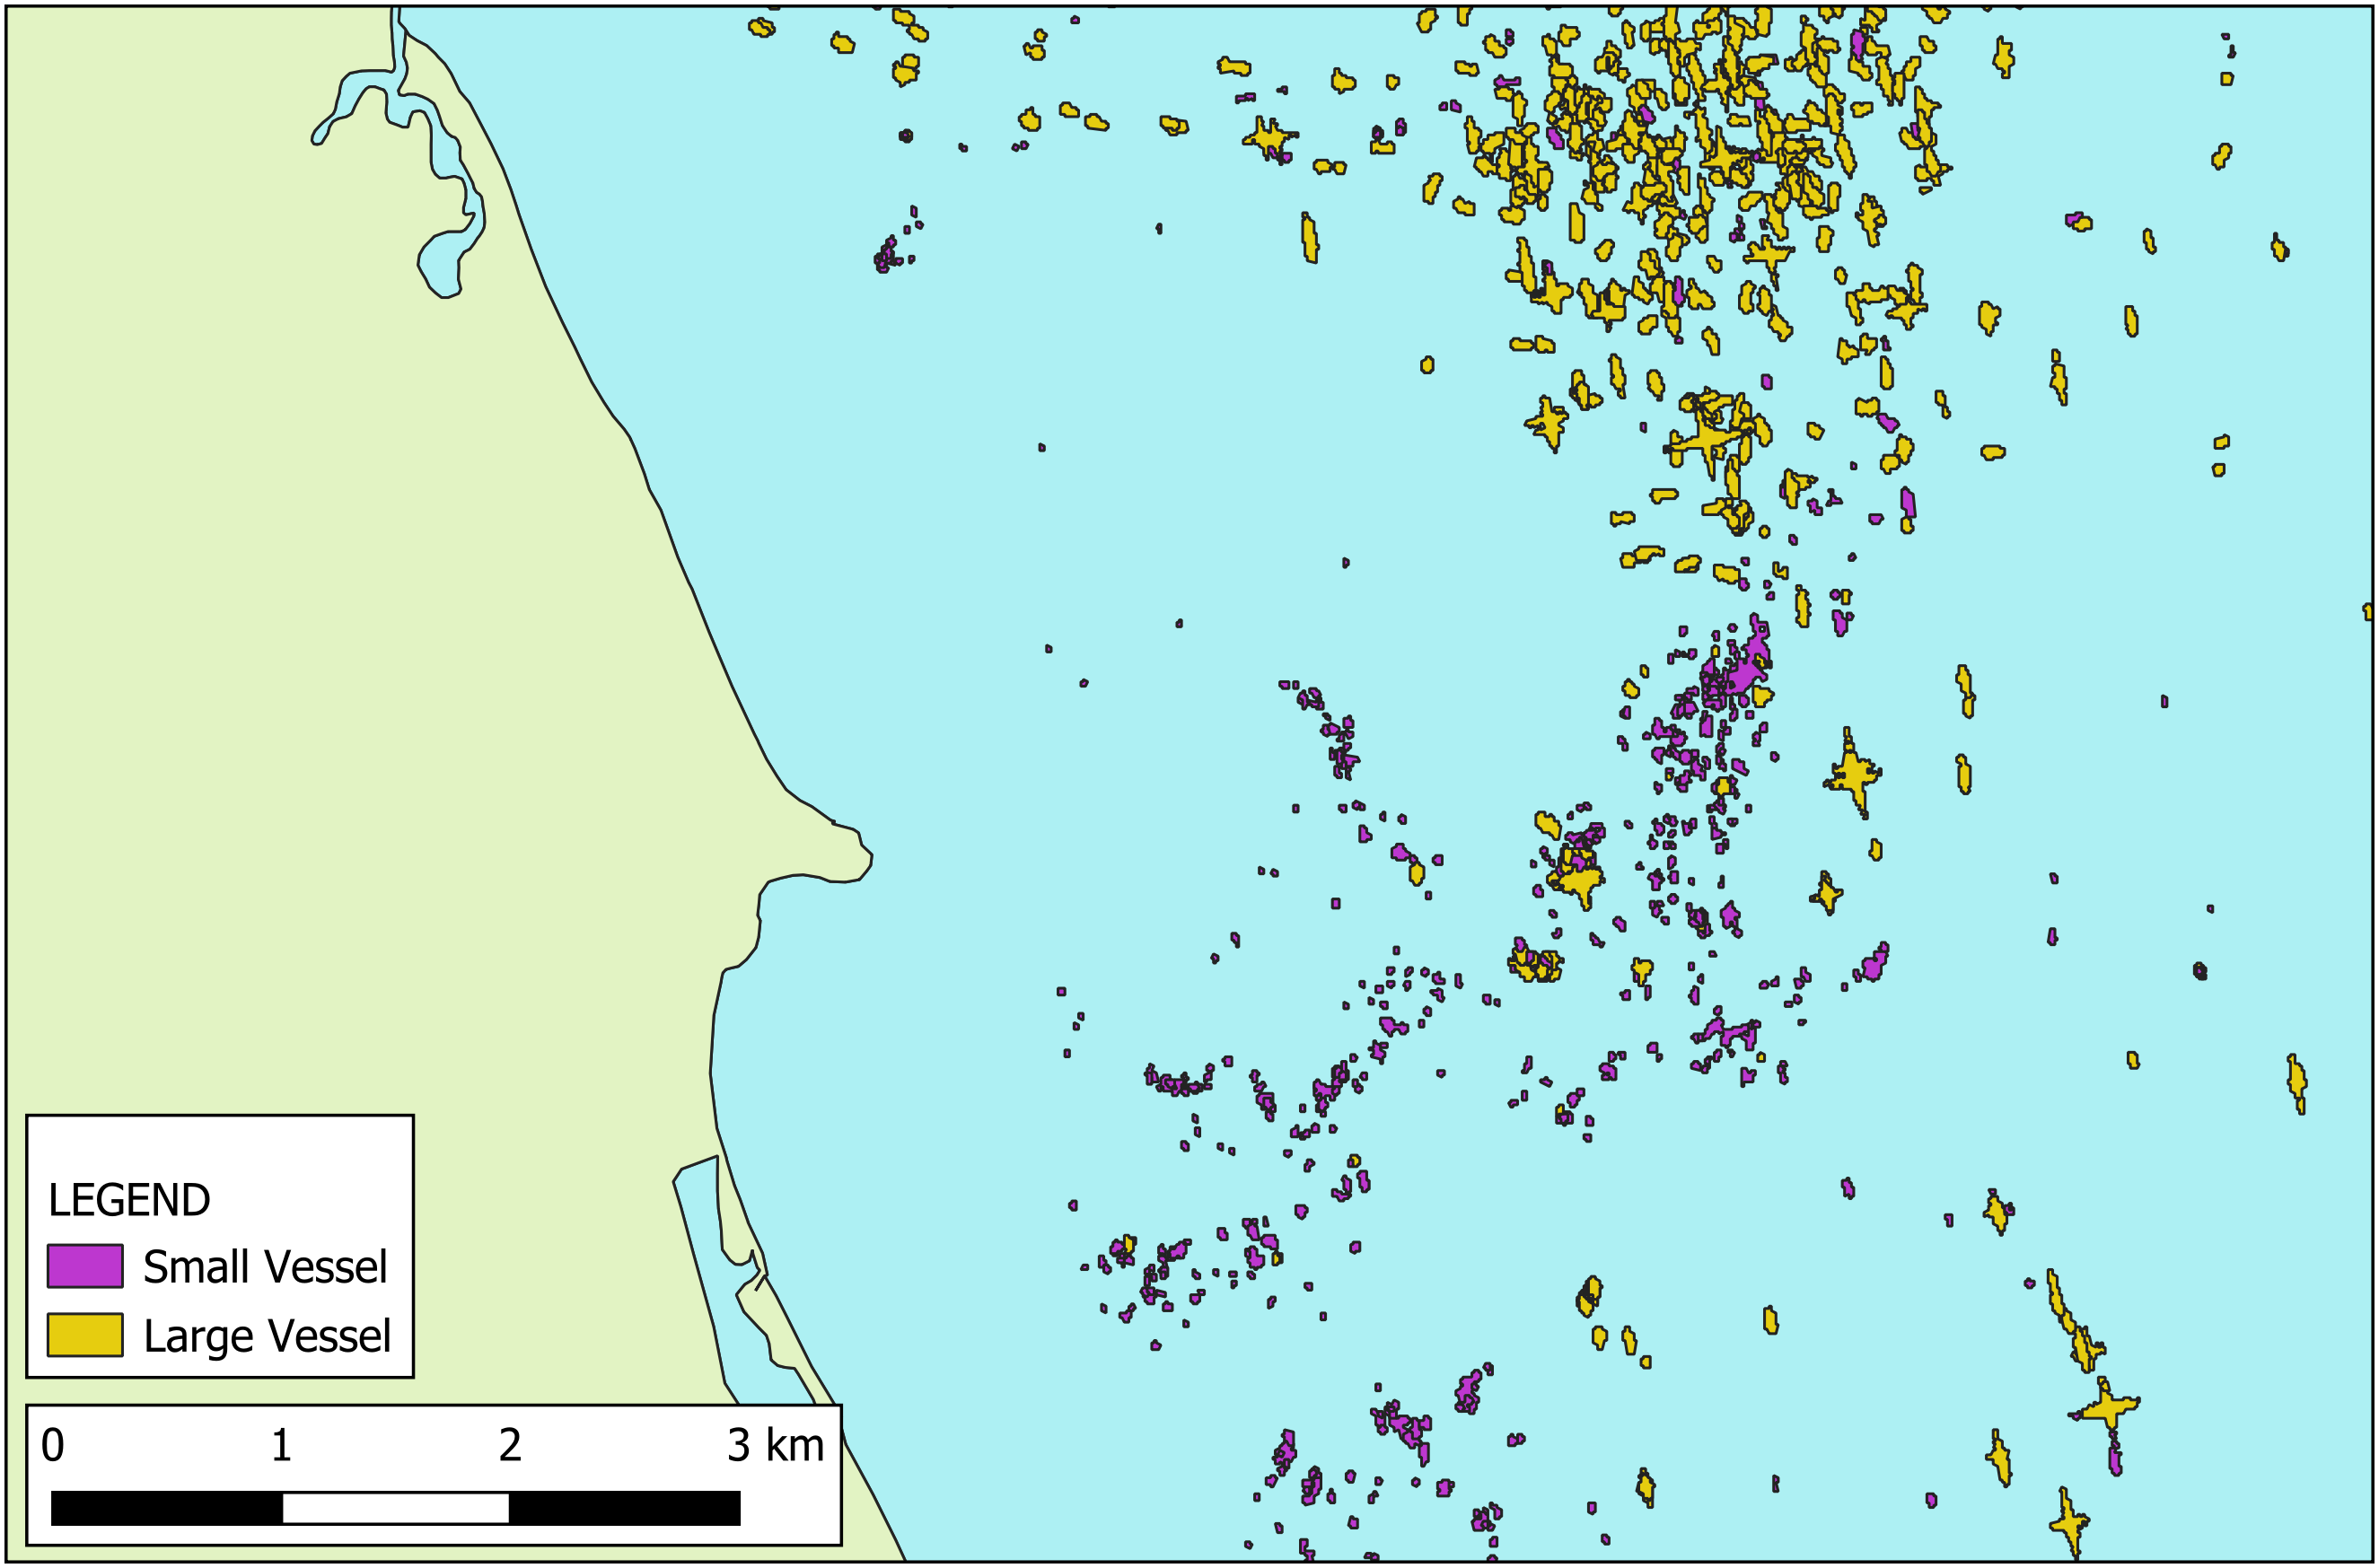
I deployed the trained model across a time series of Sentinel-1 imagery, covering the period from early 2017 to early 2025. The result is a spatial and temporal map of detected vessels.
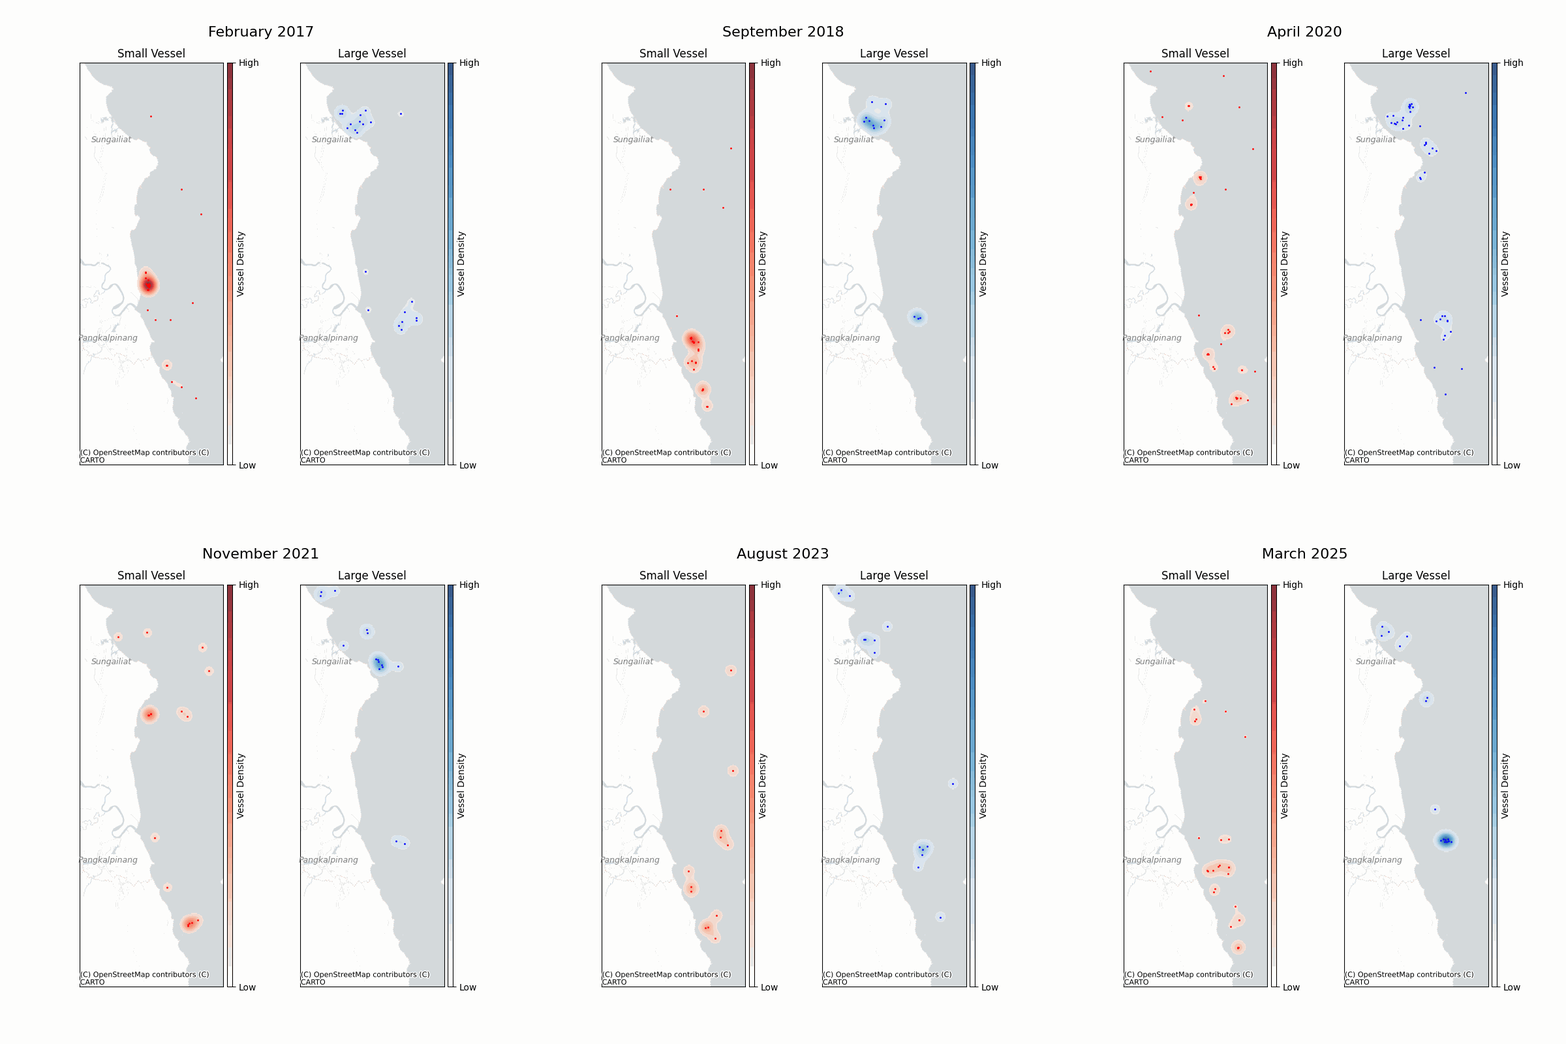
To make sense of these results, I created a time series map animatioin showing the density of both large and small vessels over time.
And add a plot to tracks the number of vessels by type at each timestamp.
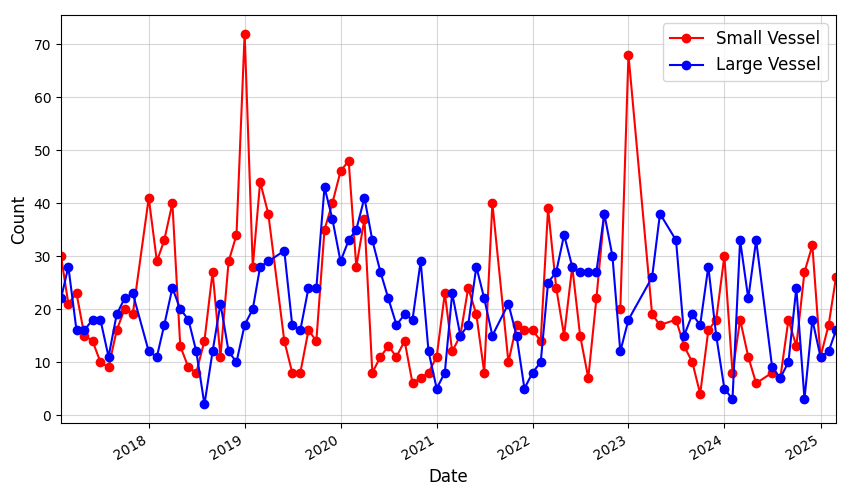
Since it is quite difficult to extract meaningful infomration from this plot alone, I used seasonal decomposition to separate long-term trends from seasonal cycles.
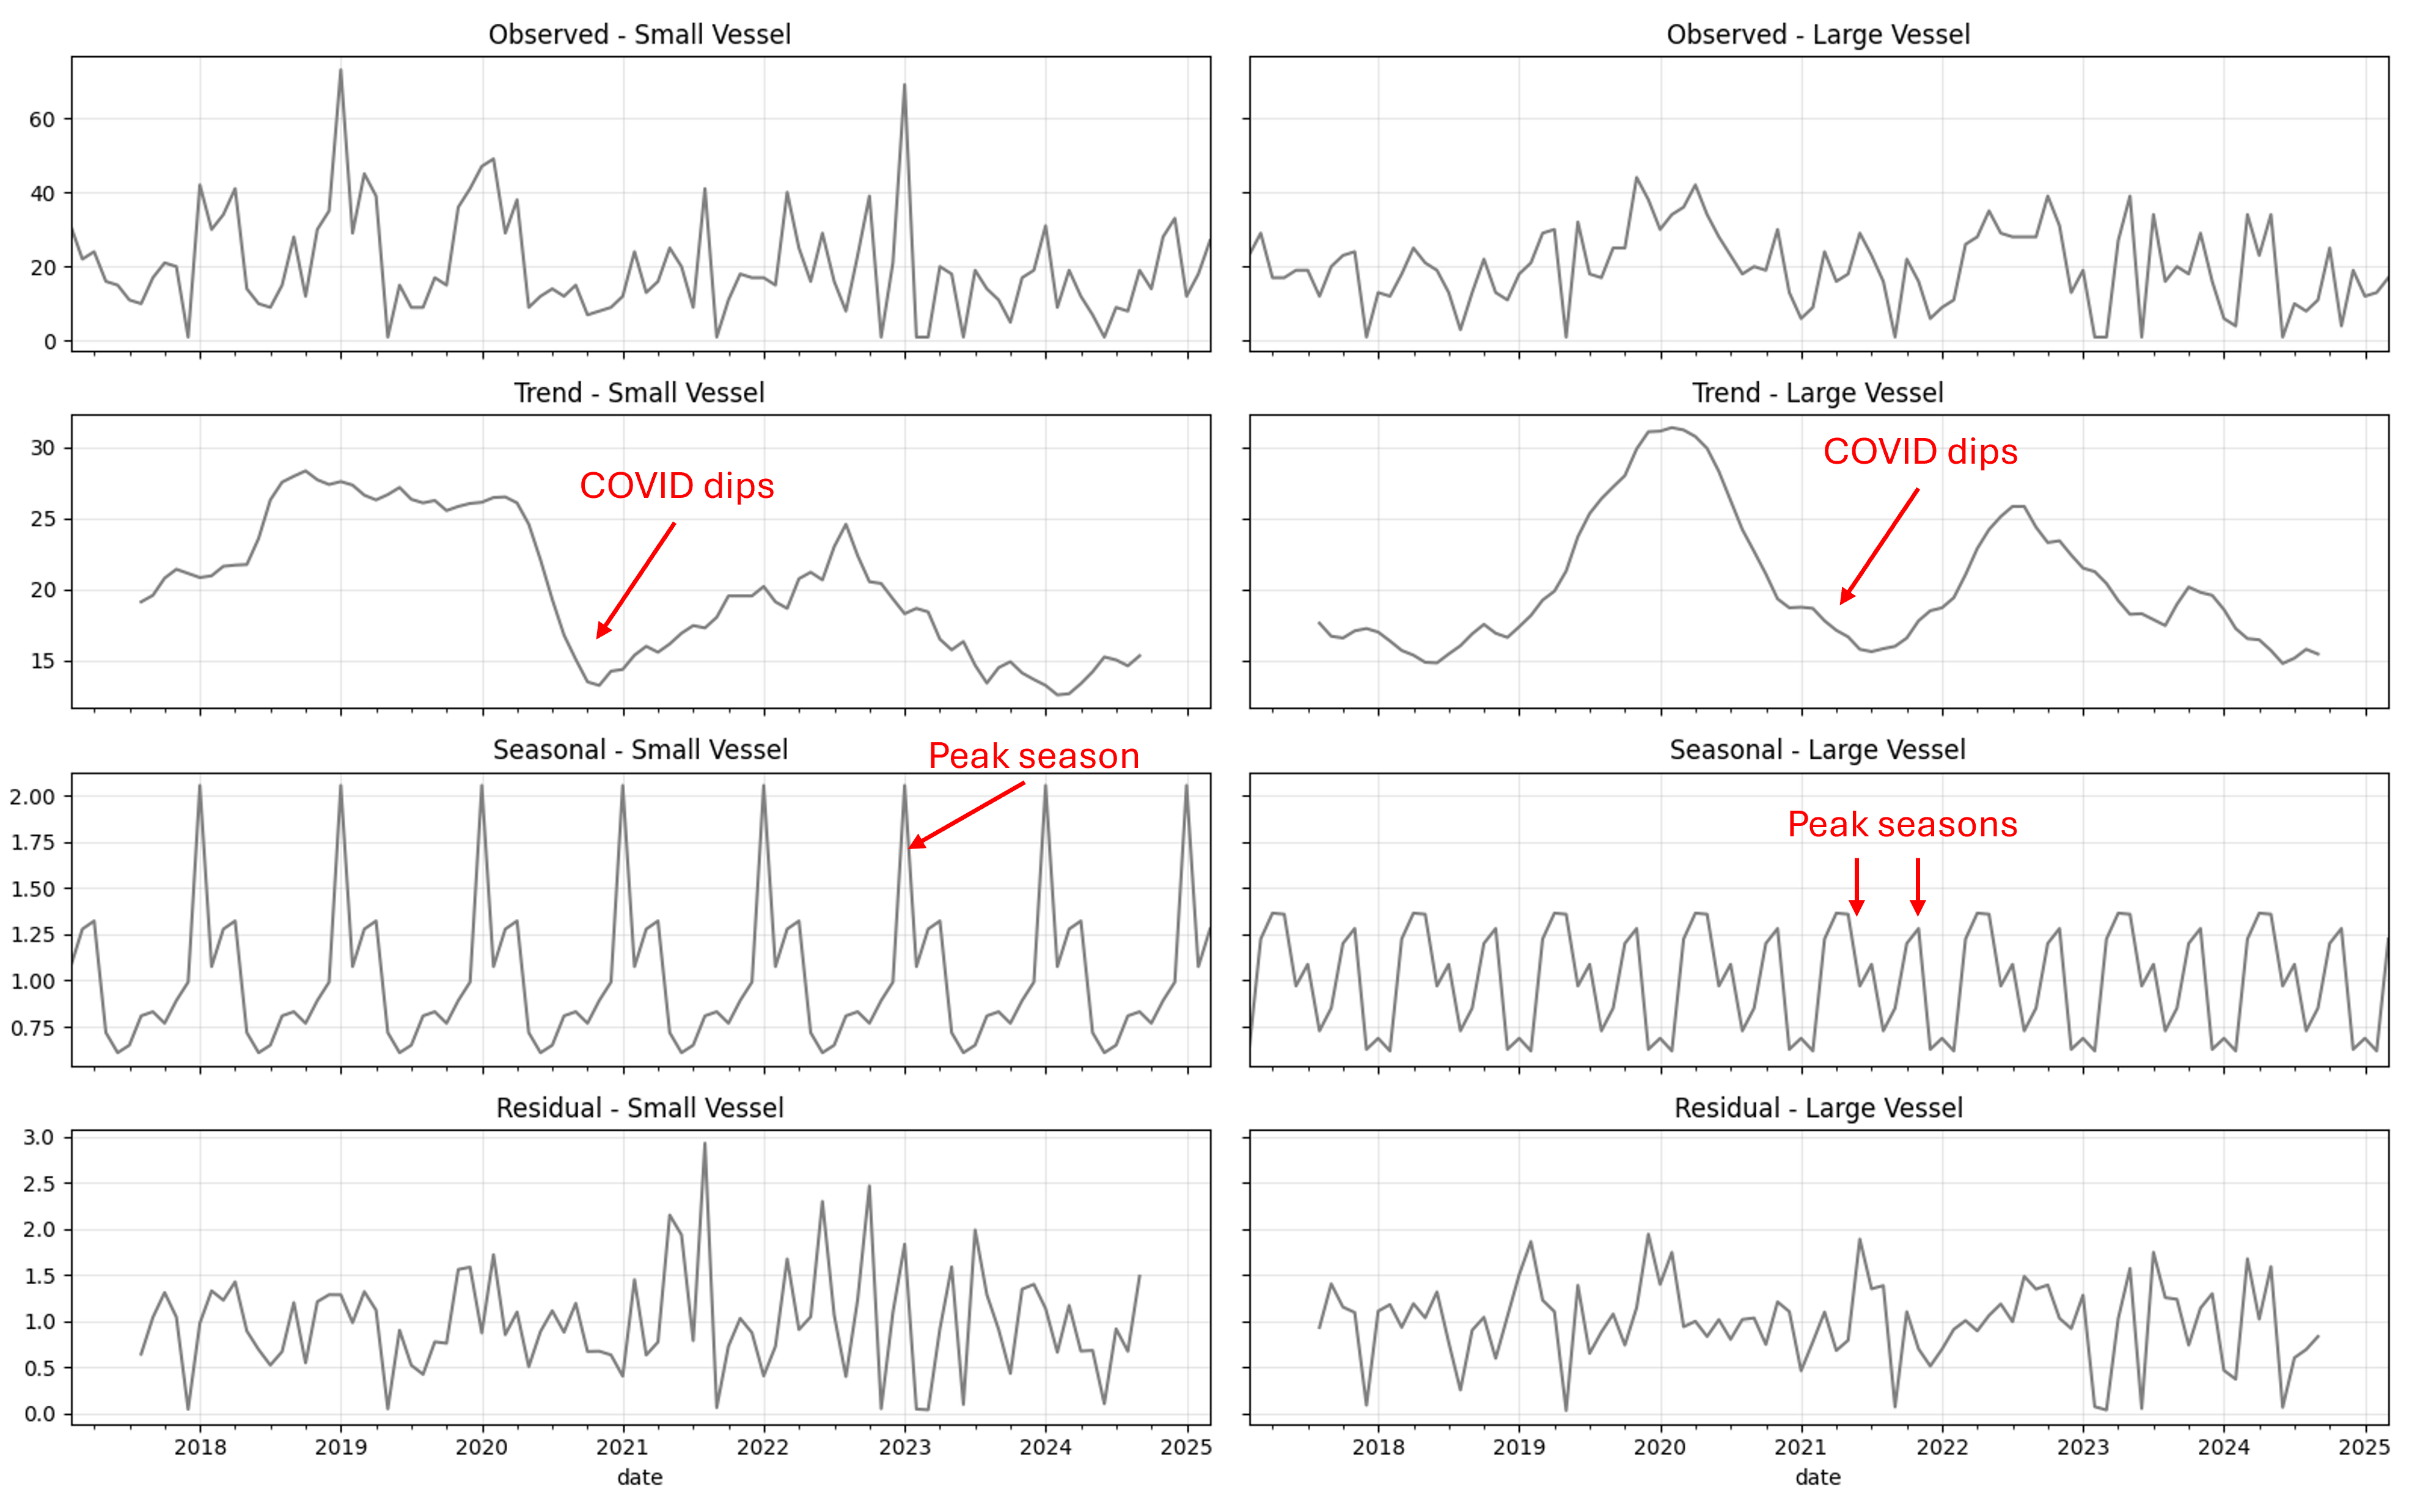
Both vessel types show the same general long term trends, and both have a sharp drop in activity around late 2020—most likely a result of the COVID-19 outbreak. The seasonal patterns are also quite interesting. Smaller vessels tend to be most active between January and March, with a noticeable peak in January. Larger vessels, on the other hand, see more activity in March to May and again in October and November.
Notes and Consideration
Since this is a mining area, most of the ships present are a mining vessel. However, other ship types are present as well, i.e. cargo ships and fishing boats. Cargo vessels tend to be large and metal-bodied, which makes them look similar to large mining dredgers in SAR imagery. On the other hand, traditional fishing boats are smaller and usually built from wood, making them potential look-alikes for artisanal mining vessels.
Ideally, these look-alike vessels would be included in the training data to reduce false positives. However, collecting reliable ground truth for them is difficult—especially because identifying vessel types often relies on cloud-free optical imagery taken at the same time as the Sentinel-1 scenes. This overlap is rare, making it harder to build a well-labeled dataset and limiting the number of high-quality training samples available for the model.
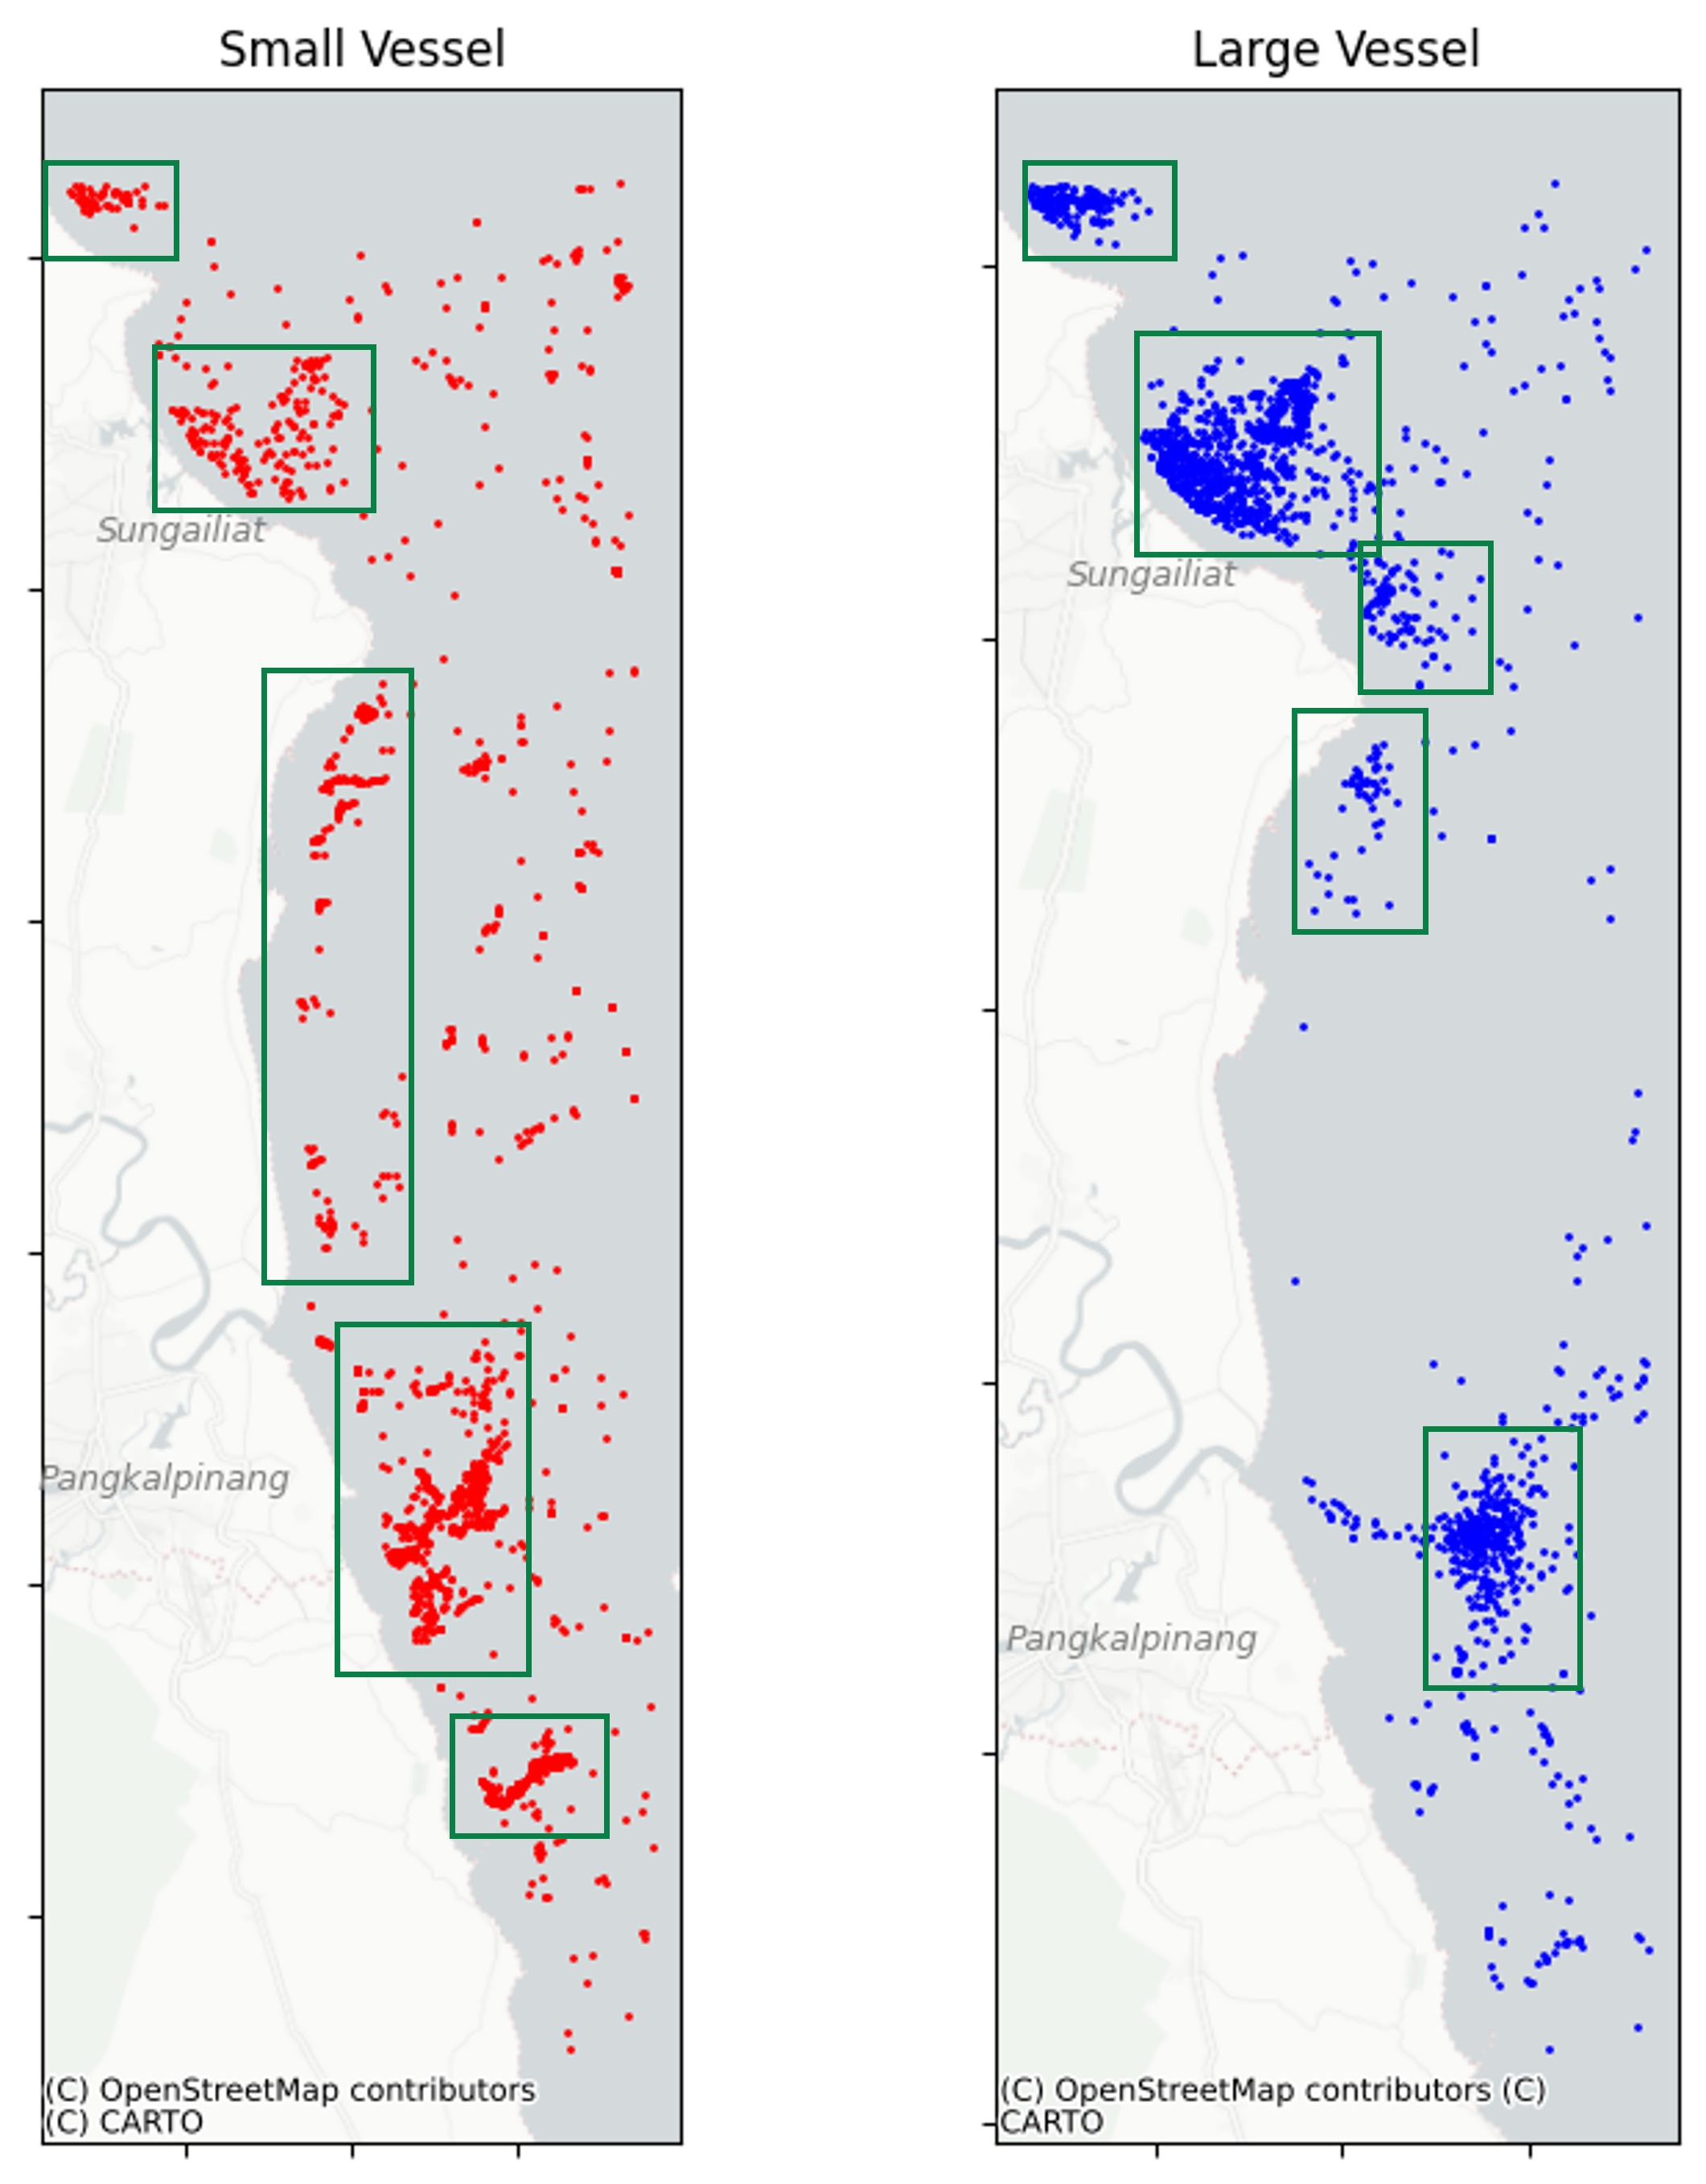
One interesting observation is that mining vessels often operate in clusters. This spatial pattern could be a useful cue for distinguishing them from other types of vessels—especially when radar backscatter alone isn’t enough.
To Wrap Up
Offshore tin mining around Bangka is a complex activity, spanning from industrial-scale operations to small artisanal efforts. Continuous monitoring of these activities could helps bring transparency to an industry that often operates in remote and loosely regulated areas. Using freely available satellite data, especially Sentinel-1 SAR, offers a promising way to monitor these activities systematically over time. While there are still challenges such as distinguishing mining vessels from other ships or dealing with limited training data, the initial results shows a strong potential to reveal a meaningful patterns.
Enjoy Reading This Article?
Here are some more articles you might like to read next: