Illegal Mining From Space
High-resolution satellite imagery provides us with global time-series data, which can be applied to various interesting applications. One such application is monitoring mining activities. There are literally thousands of mining sites across the globe, which are inherently dynamic (i.e., they undergo rapid changes over time) and often located in remote areas. This creates significant challenges for effective monitoring.
Any serious attempt at a global-scale analysis of these activities requires the use of satellite imagery in some form. Information such as the extent of mining activity, the mining methods used, and the commodities being extracted can be interpreted from satellite data. Additionally, parameters like land-use changes, soil contamination, and surface water pollution can also be analyzed using satellite imagery.
Of course, when discussing illegal mining specifically, satellite data alone may not be sufficient to characterize it fully. This is because the legal frameworks governing mining activities are often complex and vary from country to country. However, there are certain indicators that can help identify potential illegal activities. By incorporating additional layers of geospatial data, stronger evidence of illegal mining can be extracted.
Very High-Resolution Images
A wealth of information related to mining activities can be obtained from very high-resolution satellite images. The most obvious is the delineation of mining area boundaries. With time-series images, we can observe the development of mining activities and the areas they impact. Less obvious but equally important information includes the type of commodity being mined and the methods used. For those familiar with the mining industry, such details can often be inferred from satellite imagery alone. For example, coal mining can be identified by the black color of coal at the mining front or in stockpiles. Similarly, nickel and bauxite lateritic deposits often have distinct visual characteristics that are easily recognizable from space.
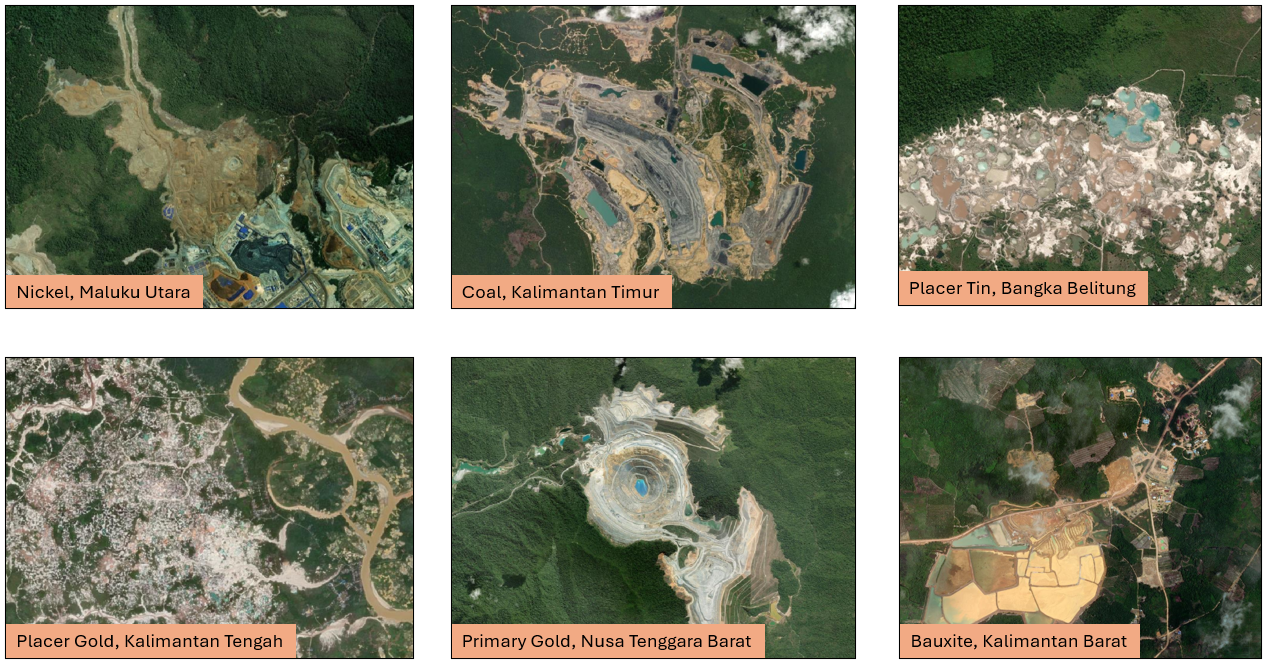
One key indicator of illegal mining that can be extracted from satellite data is the mining method. Mining activities are often categorized as formal or informal. Formal mining is conducted using appropriate tools and is planned and executed by certified engineers, resulting in well-structured mining pits and infrastructure that are clearly visible from space. In contrast, informal mining is often chaotic and sporadic, lacking proper planning and adherence to good mining practices. The latter type is frequently associated with illegal mining activity, although this is not always the case.
In Image 1 above, we can clearly see that the alluvial gold and tin mining example can be classified as informal mining. There are no visible mining infrastructures in the area, and the mining pit appears sporadic and abandoned, resembling a pond.
While proven to be very useful, a significant drawback of very high-resolution images is that they are mostly not open data, making access to large spatial and temporal-scale datasets prohibitively expensive. For this reason, large-scale studies often rely more on high-resolution images, using only scarce and limited amounts of very high-resolution data for creating training datasets and/or validation.
Automated Approach
Given the large spatial and temporal scales involved, especially for time-series analysis on a regional or global level, an automated approach to mining area delineation and classification is essential. As previously mentioned, human experts interpret mining areas based on visual aspects rather than spectral characteristics (though hyperspectral imagery can improve accuracy). These mining areas are primarily recognized by their spatial patterns. Until recently, deep learning models have proven to be the most effective solution for this type of problem.
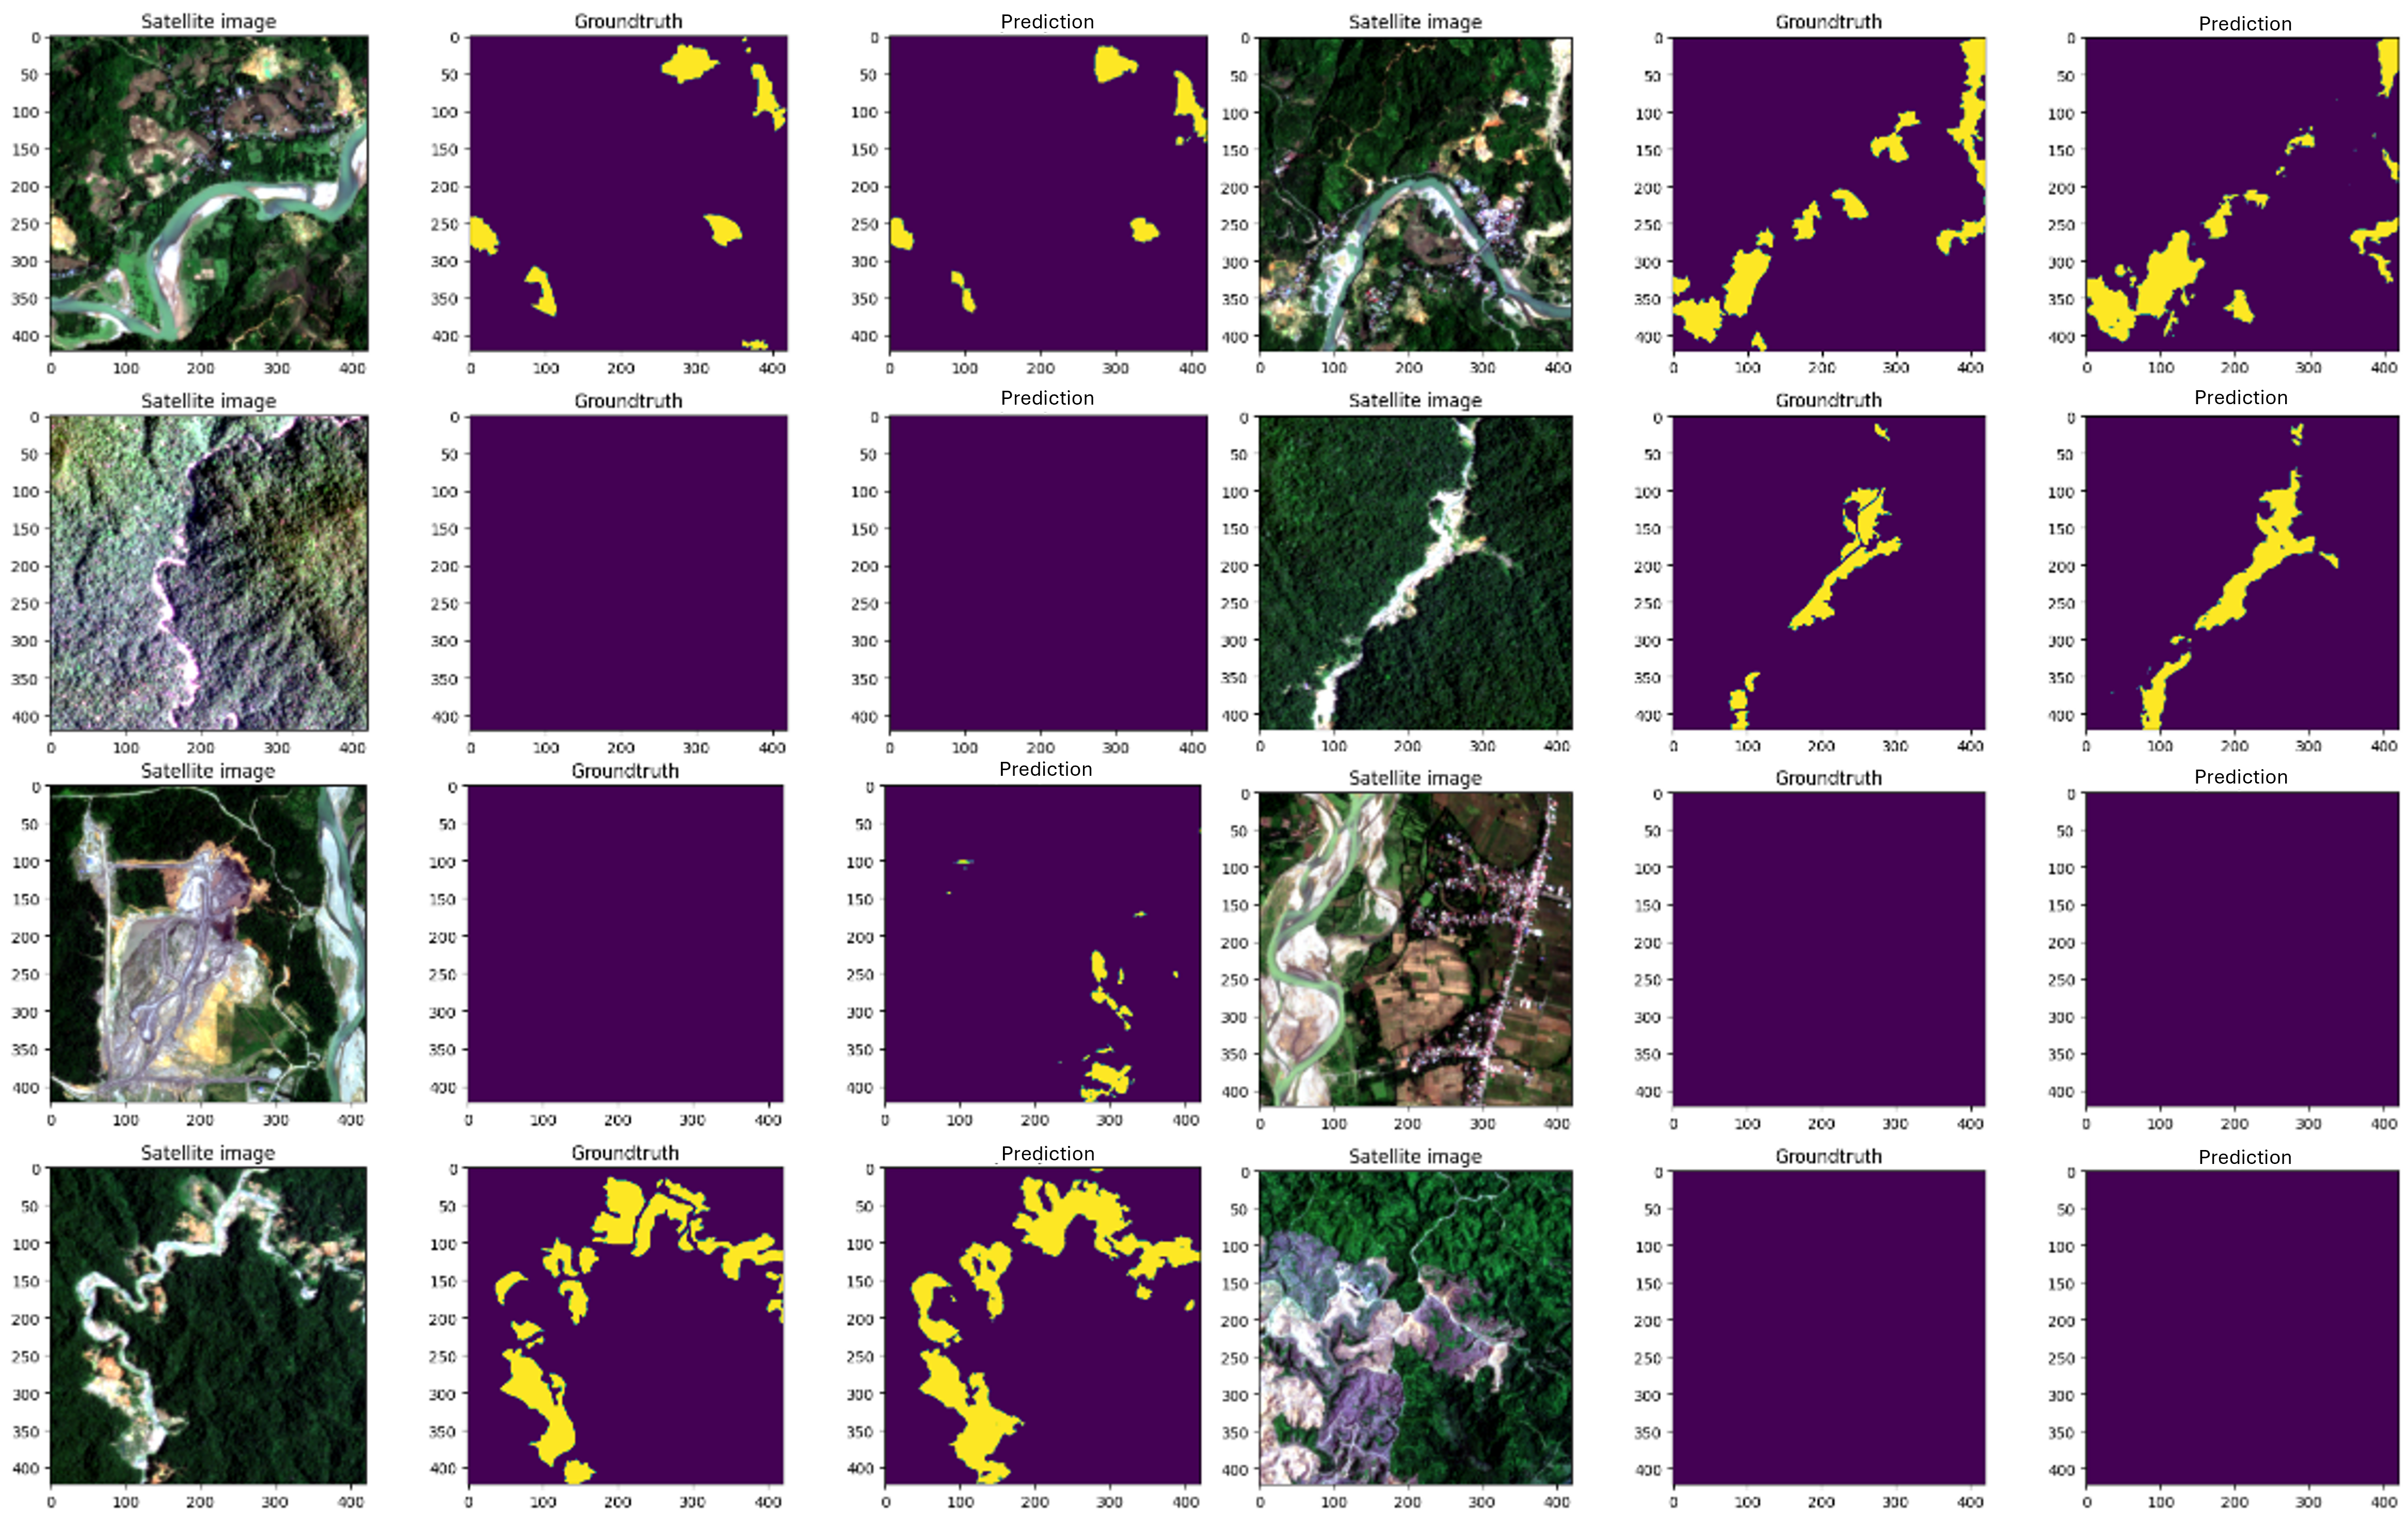
I develop a small scale deep learning model to automate delinitation of artisinal/small-scale gold mining (ASGM) in some portecteed forest area in Indonesia. I used coarser-resolution NICFI satellite data with a pixel size of 5 meters, which is still sufficient for this purpose. Even lower-resolution satellite images, such as those from Sentinel-2 or Landsat, can produce good results for delineation. The training labels for ASGM boundary were manually delineated from very high-resolution WorldView images, which were then transferred to NICFI images from the same month. The model used was a U-Net architecture, trained on 39 tiles of 256x256 pixels, augmented to 195 images through flipping and rotation. Despite the relatively small training dataset, the model performed well in tracking the development of illegal alluvial gold mining in a protected forest in Indonesia.
Below are the accuracy assessments from the validation images. The overall accuracy are 98%. Here, I only show a few validation images containing difficult scenery and look-alike features, such as large active channel bars, formal coal mining areas, and deforestation for agriculture. The model correctly labeled most of these as non-artisanal and small-scale gold mining (ASGM). Some notable false positives were detected in the ponds of formal coal mining areas. It is important to note that the current training data contain no examples of other mining types besides ASGM. Given this limitation, the fact that the model does not classify the entire area of coal mining as ASGM is already a strong result. Incorporating additional, more diverse training data would likely improve the model’s accuracy further.
After the model get a good accuracy in the testing stage, the model are deployed for a time series analysis in the subset of the study area:
Since this project also aimed to test early detection approach of mining activity, we included labels for hauling roads and mining huts, which often appear before intense mining activity begins. The model also able to deliniate huts and hauling roads as long as it is visible in the imagery by human eyes.
Environmental Impact
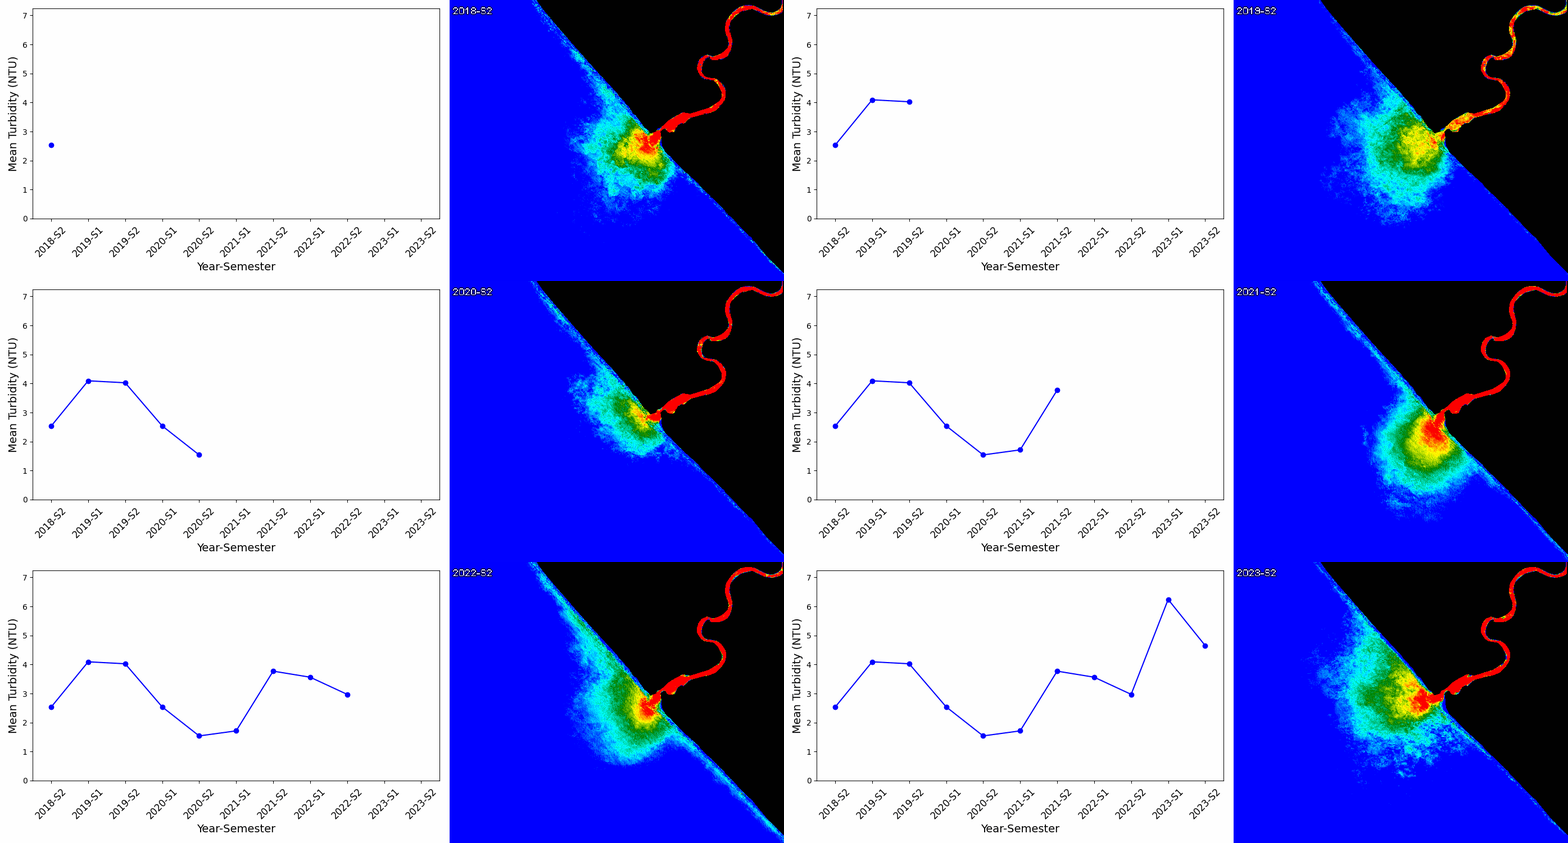
As mentioned earlier, satellite imagery can also provide insights into various environmental impacts. Below, we show an empirical model of turbidity levels in rivers downstream of the previously modeled alluvial gold mining sites from Sentinel 2 imagery. By comparing the graph of mining activity with turbidity levels, we can observe a temporary pause in mining activity from late 2019 to 2021, likely due to the COVID-19 pandemic. During the same period, we also observed a decrease in river turbidity, suggesting a direct link between mining activity and river pollution.
Further Analysis with Additional Geospatial Data Layers
For legal and compliance analysis, a reasonable first step is to overlay the generated mining area outlines with other geospatial data layers linked to regulations governing mining activities in a specific country. For example, in Indonesia, we can use mining concession boundaries to determine whether mining activities are conducted within valid permit areas. We can also add data layers related to environmentally restricted areas, such as conservation zones, protected forests, and riparian zones, where mining is prohibited. This is a first-order approach to analyzing compliance levels. As previously stated, the complete regulatory framework for mining is complex, and further detailed analysis is needed for conclusive statements. However, this level of analysis is often sufficient to assess and estimate compliance at a national level.
Below is an example of the national level overlay results in Indonesia using data from 2019. Note that the data used in this example are not official and may be incorrect, false, or inaccurate. Nevertheless, the purpose of this post is to demonstrate how compliance levels of mining activities can be assessed using remote sensing and basic geospatial analysis.The results of this data overlay include the percentage of mining areas inside and outside concession boundaries, as well as the percentage of mining areas within environmentally restricted zones.
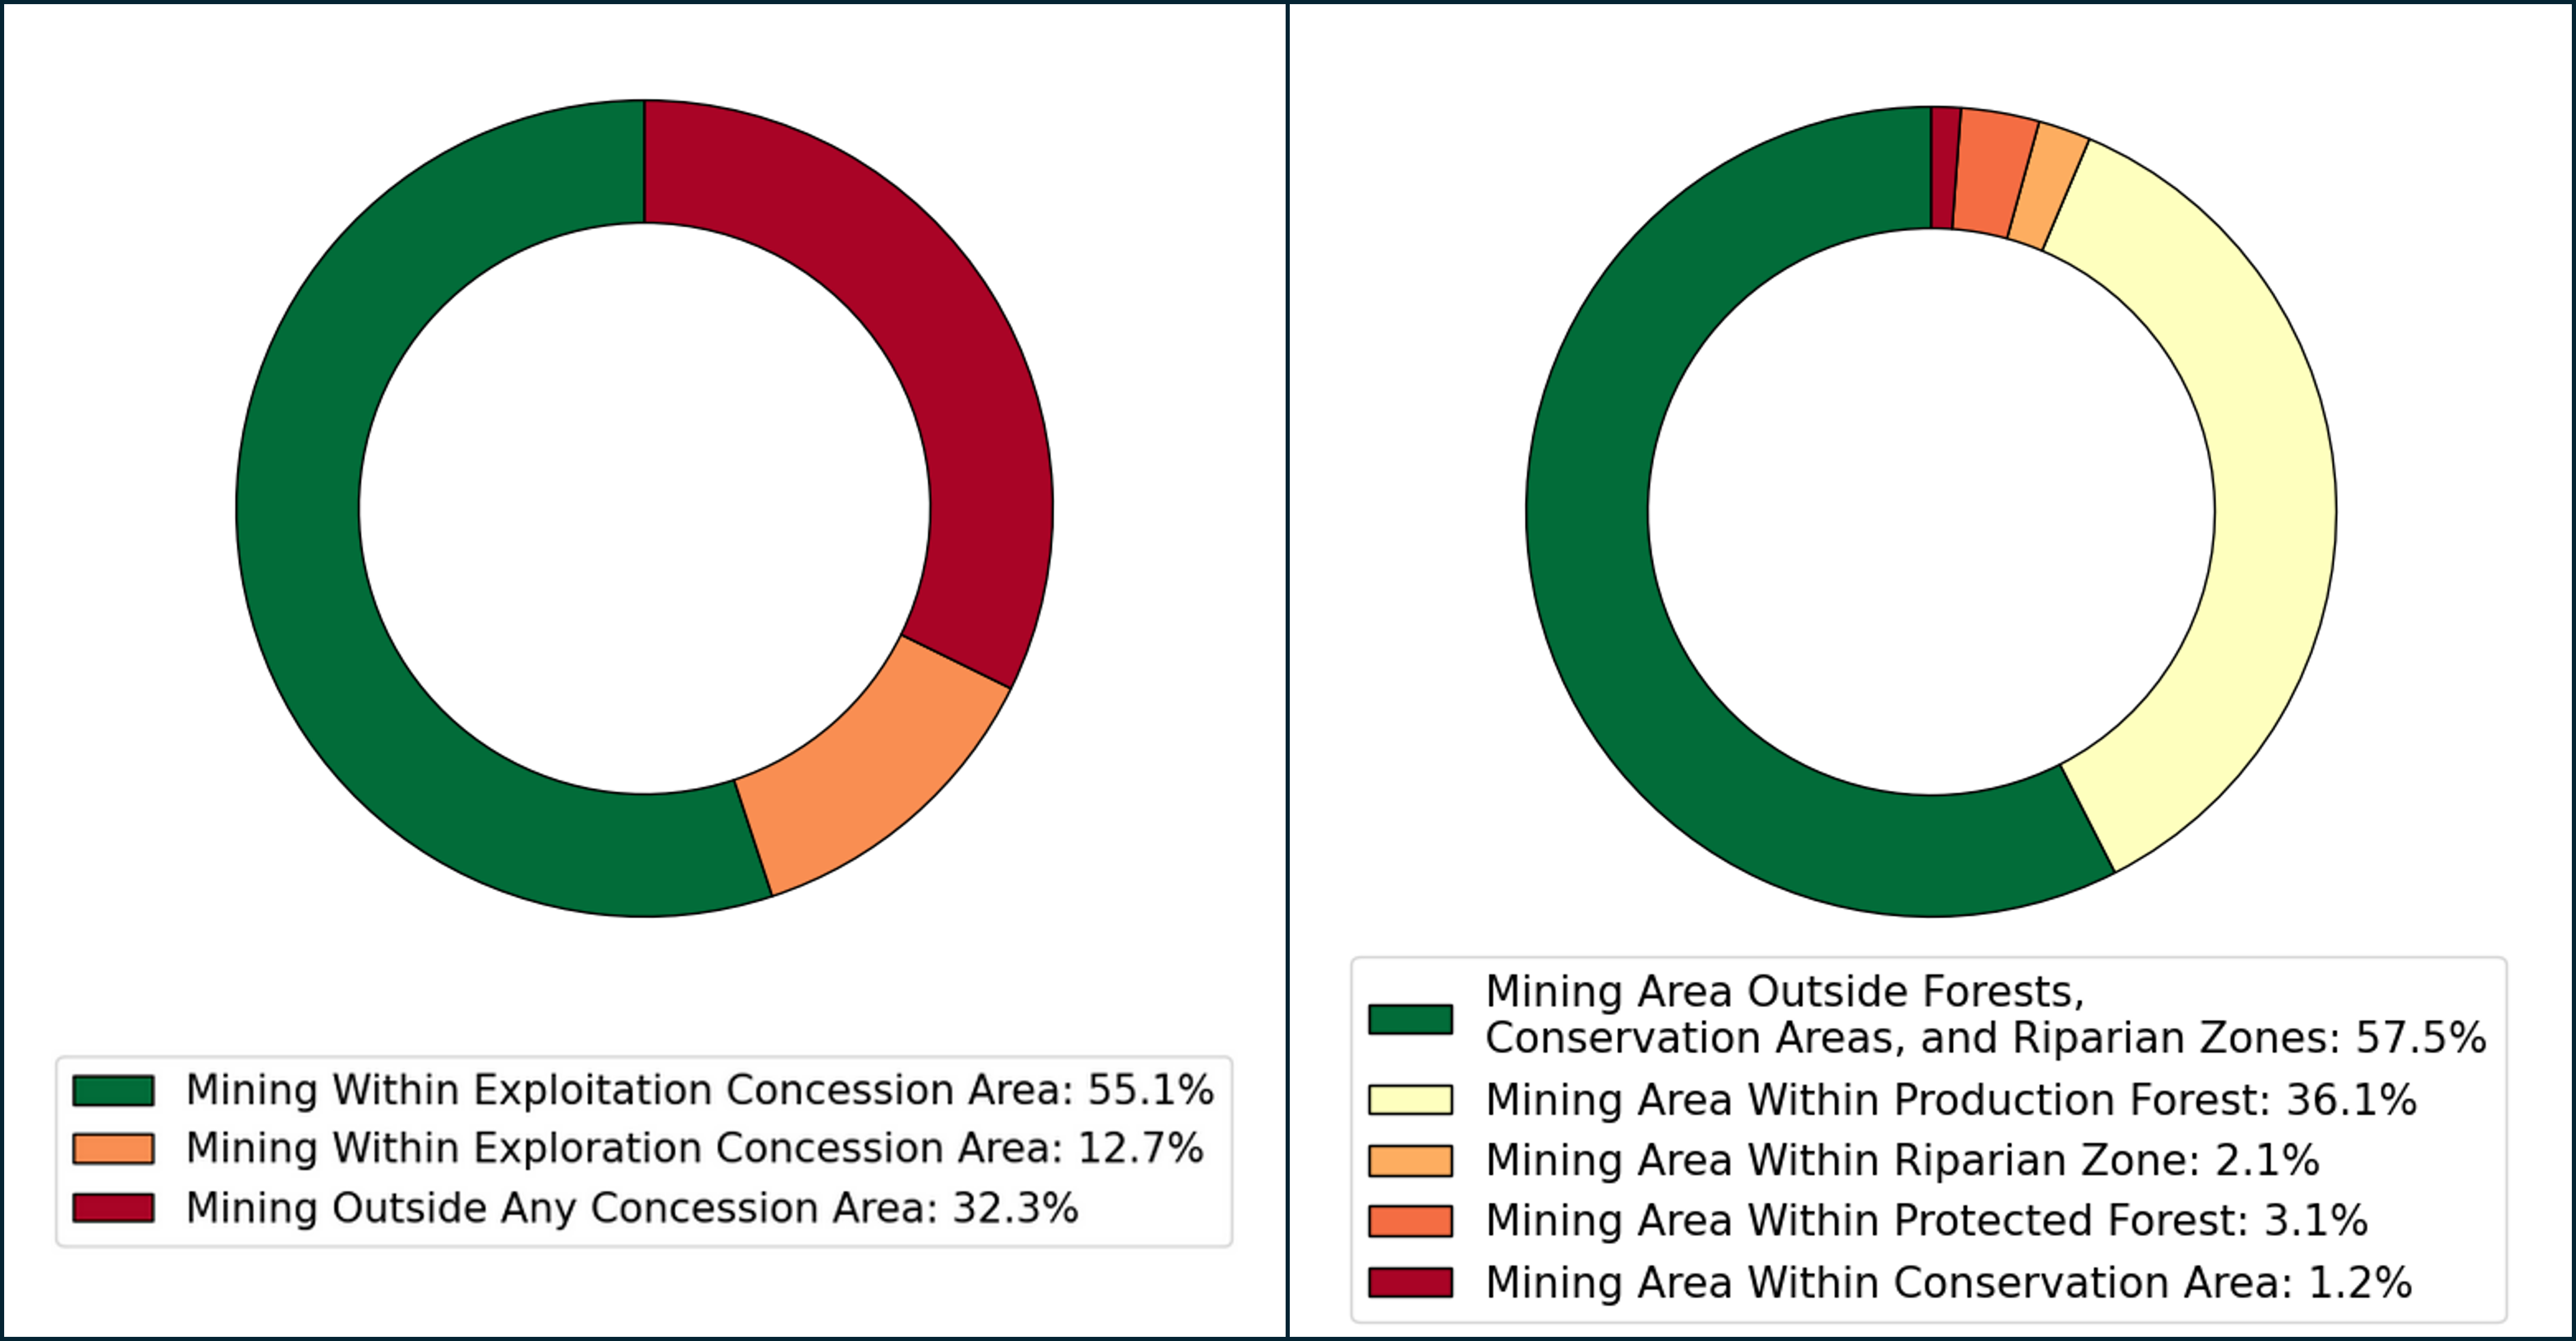
Complience Analysis
To better understand the overlay results, we need to consider relevant regulations. In this study, we incorporated data layers related to mining permits and land-use-based environmental restrictions. These layers help analyze the compliance of mining activities with legal and environmental regulations. Below are the key regulatory frameworks considered:
- According to UU No. 4 Tahun 2009, mining activities outside of their designated exploitation concession boundaries are strictly prohibited.
- According to UU No. 41 Tahun 1999, any land-use activity, including mining, is prohibited within conservation areas.
- According to UU No. 41 Tahun 1999, surface mining in protected forests is prohibited. Underground mining activity. However, underground mining may be allowed under specific conditions.
- According to UU No. 41 Tahun 1999, surface mining in production forests is prohibited. Nevertheless, special licenses may be granted to permit mining activities under additional requirements.
- According to PP No. 38 Tahun 2011, any land-use activity, including mining, is prohibited within riparian zones. However, special licenses may be issued to allow the redirection of river flows and riparian zones under certain conditions.
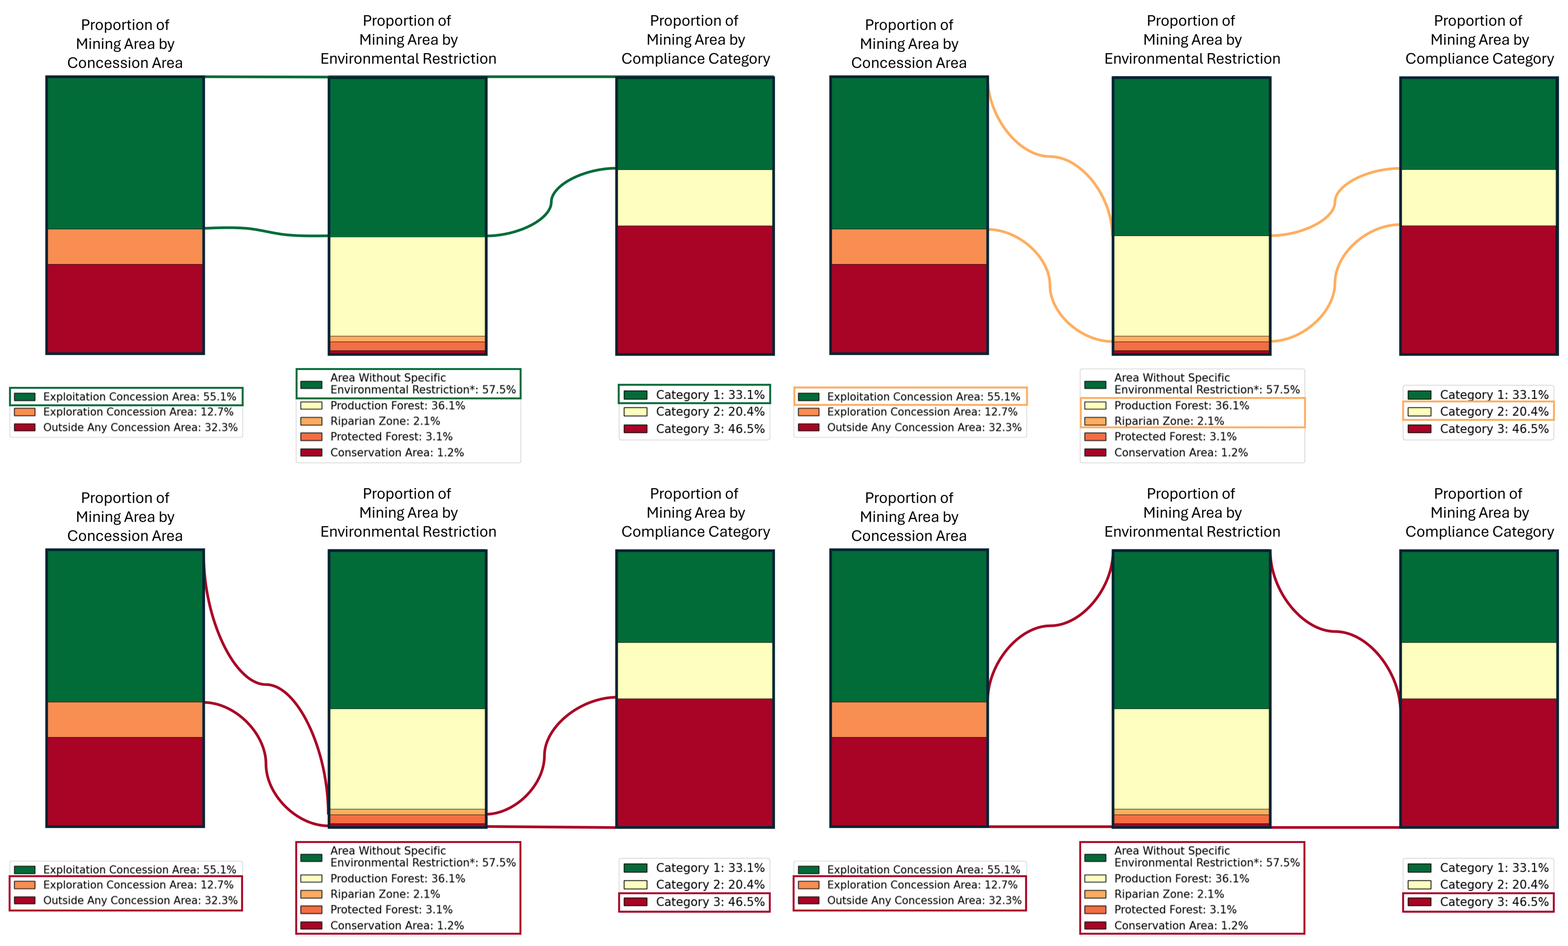
based on these we will classify mining activity activity into three different complience category:
- Category 1: High Compliance This is the highest compliance class. Mining areas in this category are located:
- Within exploitation concession boundaries, and
- Outside any land-use-based environmental restriction areas.
- Category 2: Conditional Compliance Mining areas in this category are:
- Within exploitation concession boundaries, but
- Located within production forests or riparian zones.
- If these mining activities have obtained the necessary additional permits to operate in production forests and/or redirect rivers, their compliance status aligns with Category 1.
- Category 3: Low Compliance This is the least compliance class in this analysis. The mining area are This is the least compliant category. Mining areas in this class are either:
- Located within exploitation concession boundaries but also in protected forests or conservation areas, where mining is strictly prohibited, or
- Situated outside any concession boundaries, regardless of other restrictions.
The chart below visualize the categorization of the mining areas:
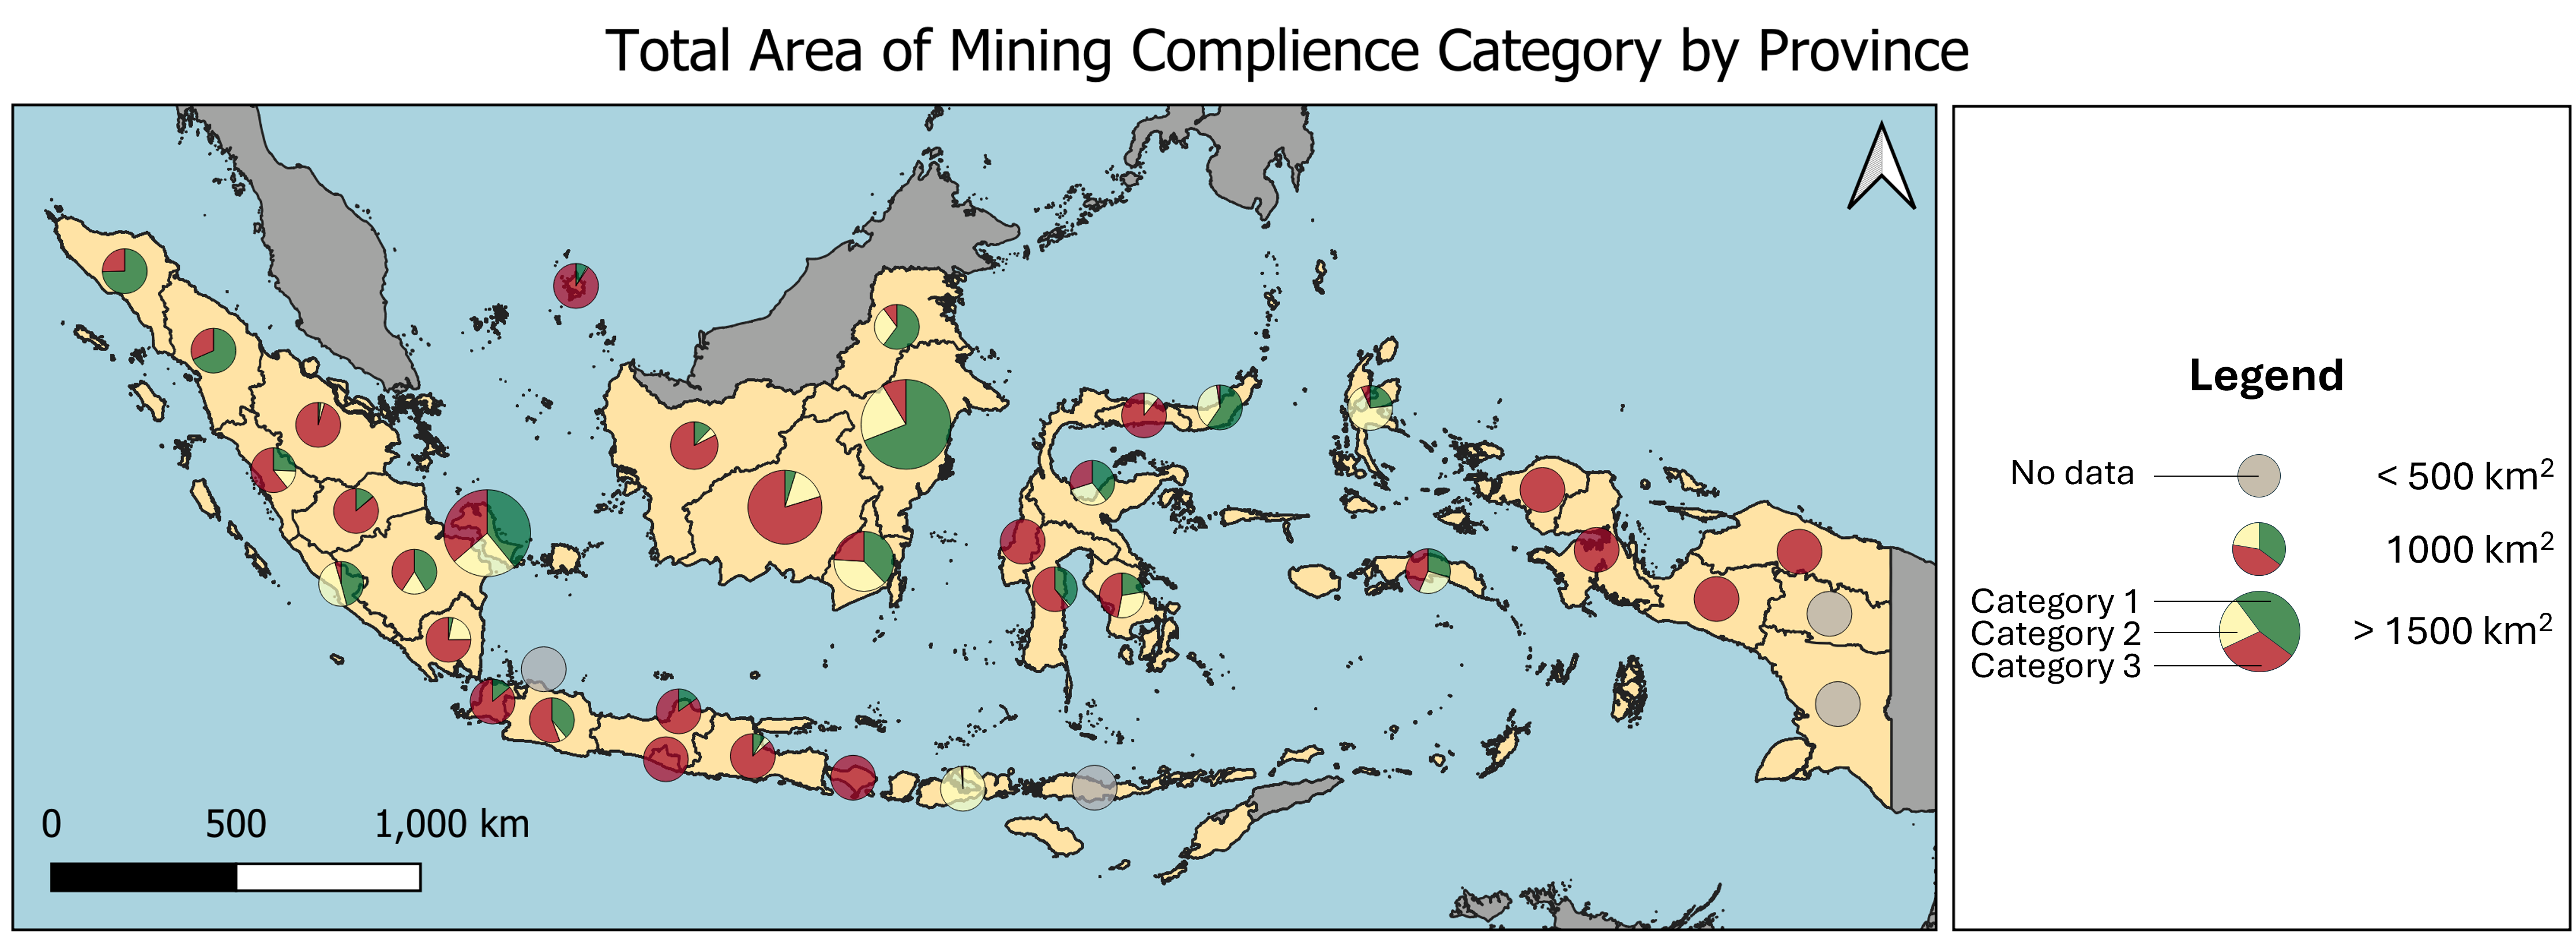
The result can also be visualized on province basis using pie chart map as shown below:
Further analysis
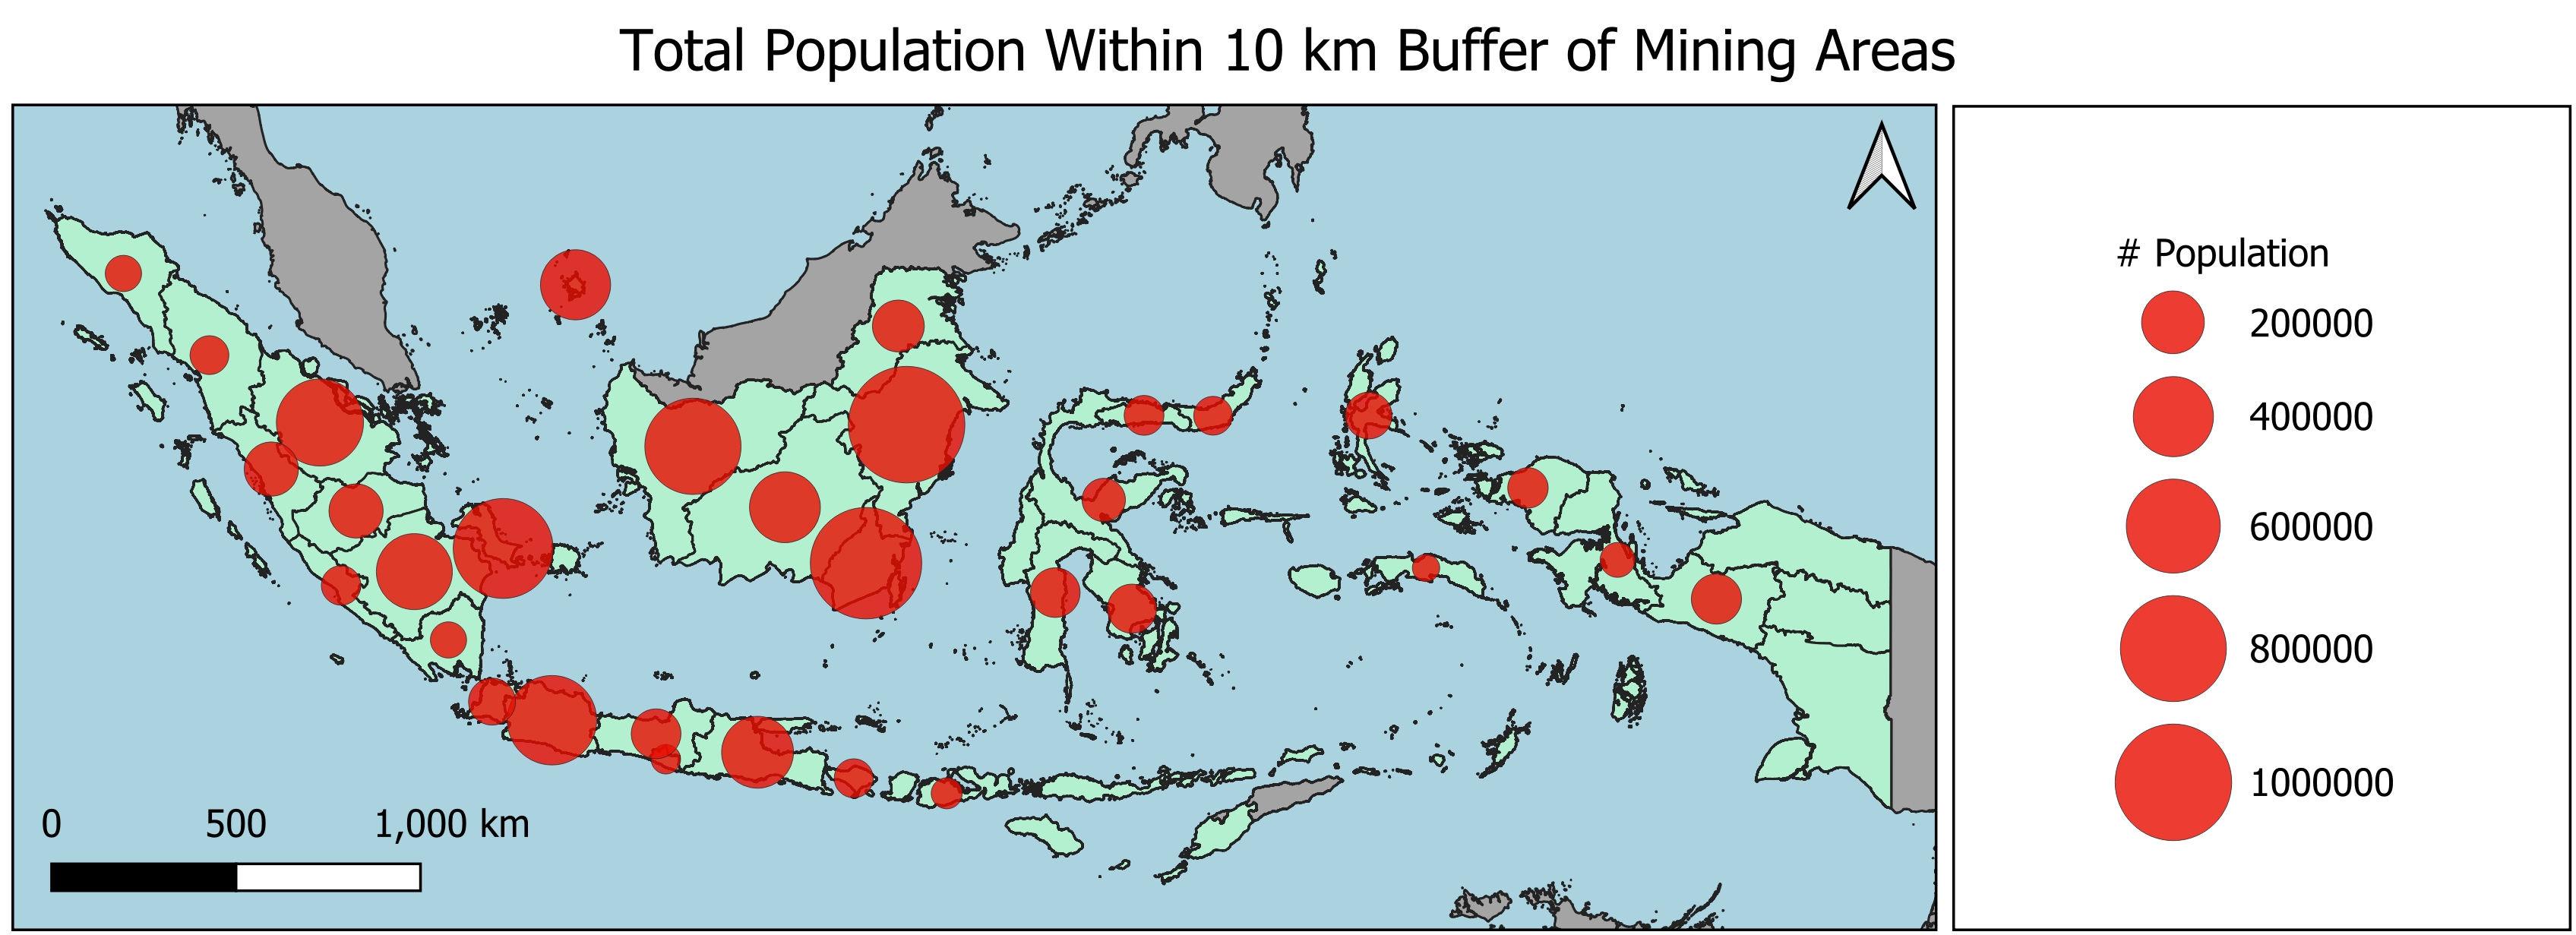
I also think it would be interesting to combine this dataset with detailed census data. For example, I attempted to combine it with the WorldPop gridded population dataset to estimate the number of people living within a 10 km buffer of mining areas. This helps identify the potential population directly impacted by mining activities. Further analysis of health, education, and income data for this population could be valuable for future research.
Conclussion
Satellite imagery provides extensive spatial and temporal coverage, making it a valuable tool for large-scale monitoring of terrestrial activities, including illegal mining. Using satellite data alone, we can extract information such as mining boundaries over time, mining methods, commodities, and environmental impacts. In our small-scale test, we demonstrated how deep learning can automate the mining boundary delineation process with good accuracy. To assess the compliance status of mining activities, additional geospatial data layers are required. In this example, we used unofficial mining concession boundaries and environmentally restricted area boundaries as an example. This simple yet effective approach enables high-scale monitoring to identify trends in mining activities and their compliance with regulations.
Enjoy Reading This Article?
Here are some more articles you might like to read next: