Mapping Lithium Bearing Mineral in Granite Core Sample with Hyperspectral Imaging
Detecting lithium in rocks is a known challenge. Standard tools like handheld or desktop XRF can’t pick it up due to lithium’s low atomic number (Z=3). Advanced techniques such as ICP-MS, LA-ICP-MS, and LIBS can measure lithium, but they come with trade-offs: they’re expensive, time-consuming, and at least mildly destructive.
At exploration stage, the focus tend to shift to lithium host minerals rahter than the lithium itself, especially spodumene (pyroxene group), lepidolite (mica group), and cookeite (chlorite group). These minerals are more practical to detect using common analytical tools such as XRD, Raman spectroscopy, or reflectance spectroscopy like ASD and Hyperspectral Imaging (HSI). While XRD and Raman have their strengths, HSI offers unique advantages: it’s non-destructive, spatially continuous (100–500 μm resolution), and scalable—from thin sections to core samples, outcrops, and even satellite scenes.
In this post, I’ll show a case study using hyperspectral imaging on a small section of a lithium-bearing granite core sample from Devon, UK.
Spectral Signatures
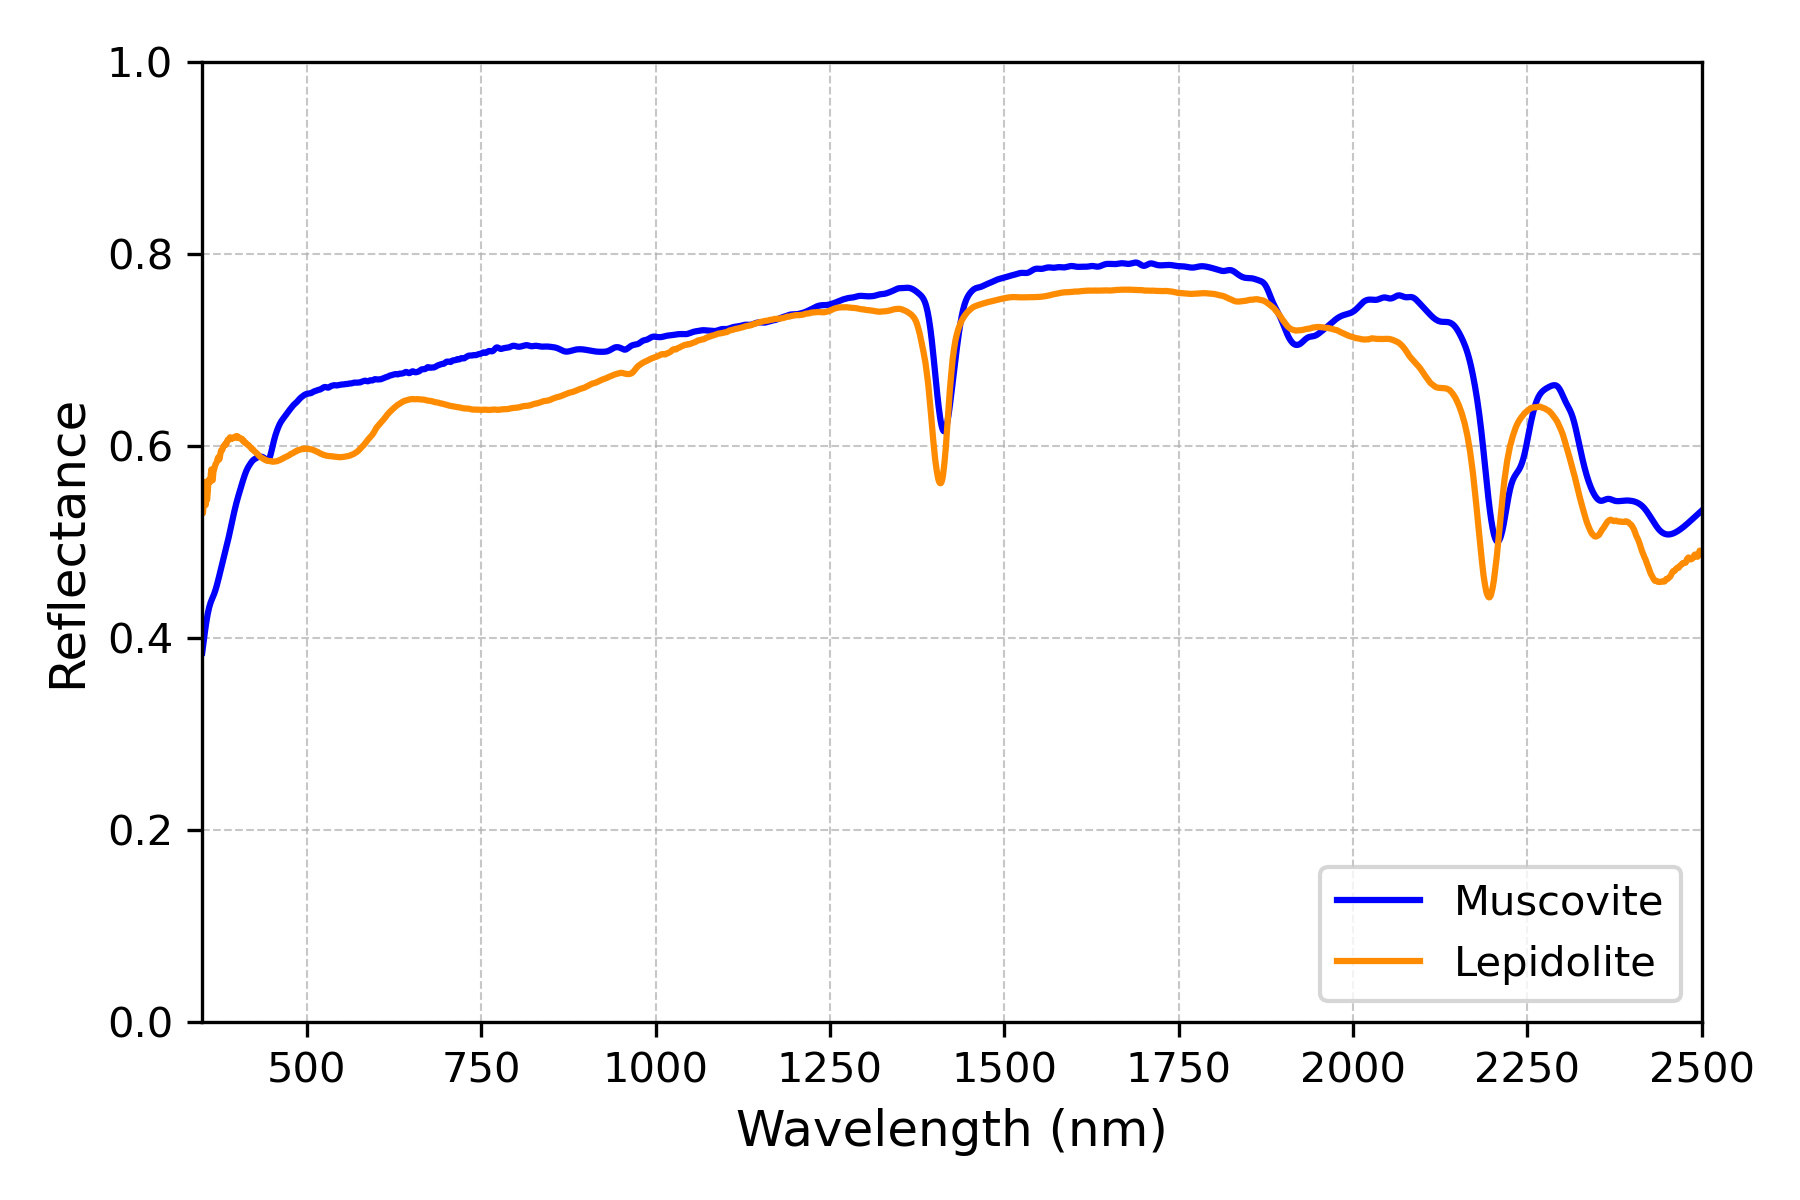
distinguish between different white mica species, as only lepidolite contains lithium. White micas exhibit absorption features near 1400 nm, 1900 nm, and especially around 2200 nm due to OH vibrational overtones. Differentiating between species requires detecting subtle shifts in the ~2200 nm feature.
Muscovite, which contains Al-OH bonds, shows an absorption feature near 2206 nm. When Al is substituted by other cations like Fe, Mg, or Li, the position of this feature shifts. Specifically, Fe- and Mg-rich white micas such as phengite shift the feature to longer wavelengths (~2230 nm), while Li-rich micas like lepidolite shift it to shorter wavelengths (~2195 nm). In this rock sample, we observe this feature ranging from ~2195 nm to ~2208 nm, indicating a compositional transition from lepidolite to muscovite.

Minimum Wavelength Mapping
To visualize subtle shifts in absorption features, we use Minimum Wavelength Mapper. Generally this method can be devided into four steps.
- Detect the deepest absorption feature within a chosen wavelength range.
- Fit a 2nd-order polynomial around the feature to interpolate the true minimum (often sub-band resolution).
- Extract the interpolated wavelength position and absorption depth.
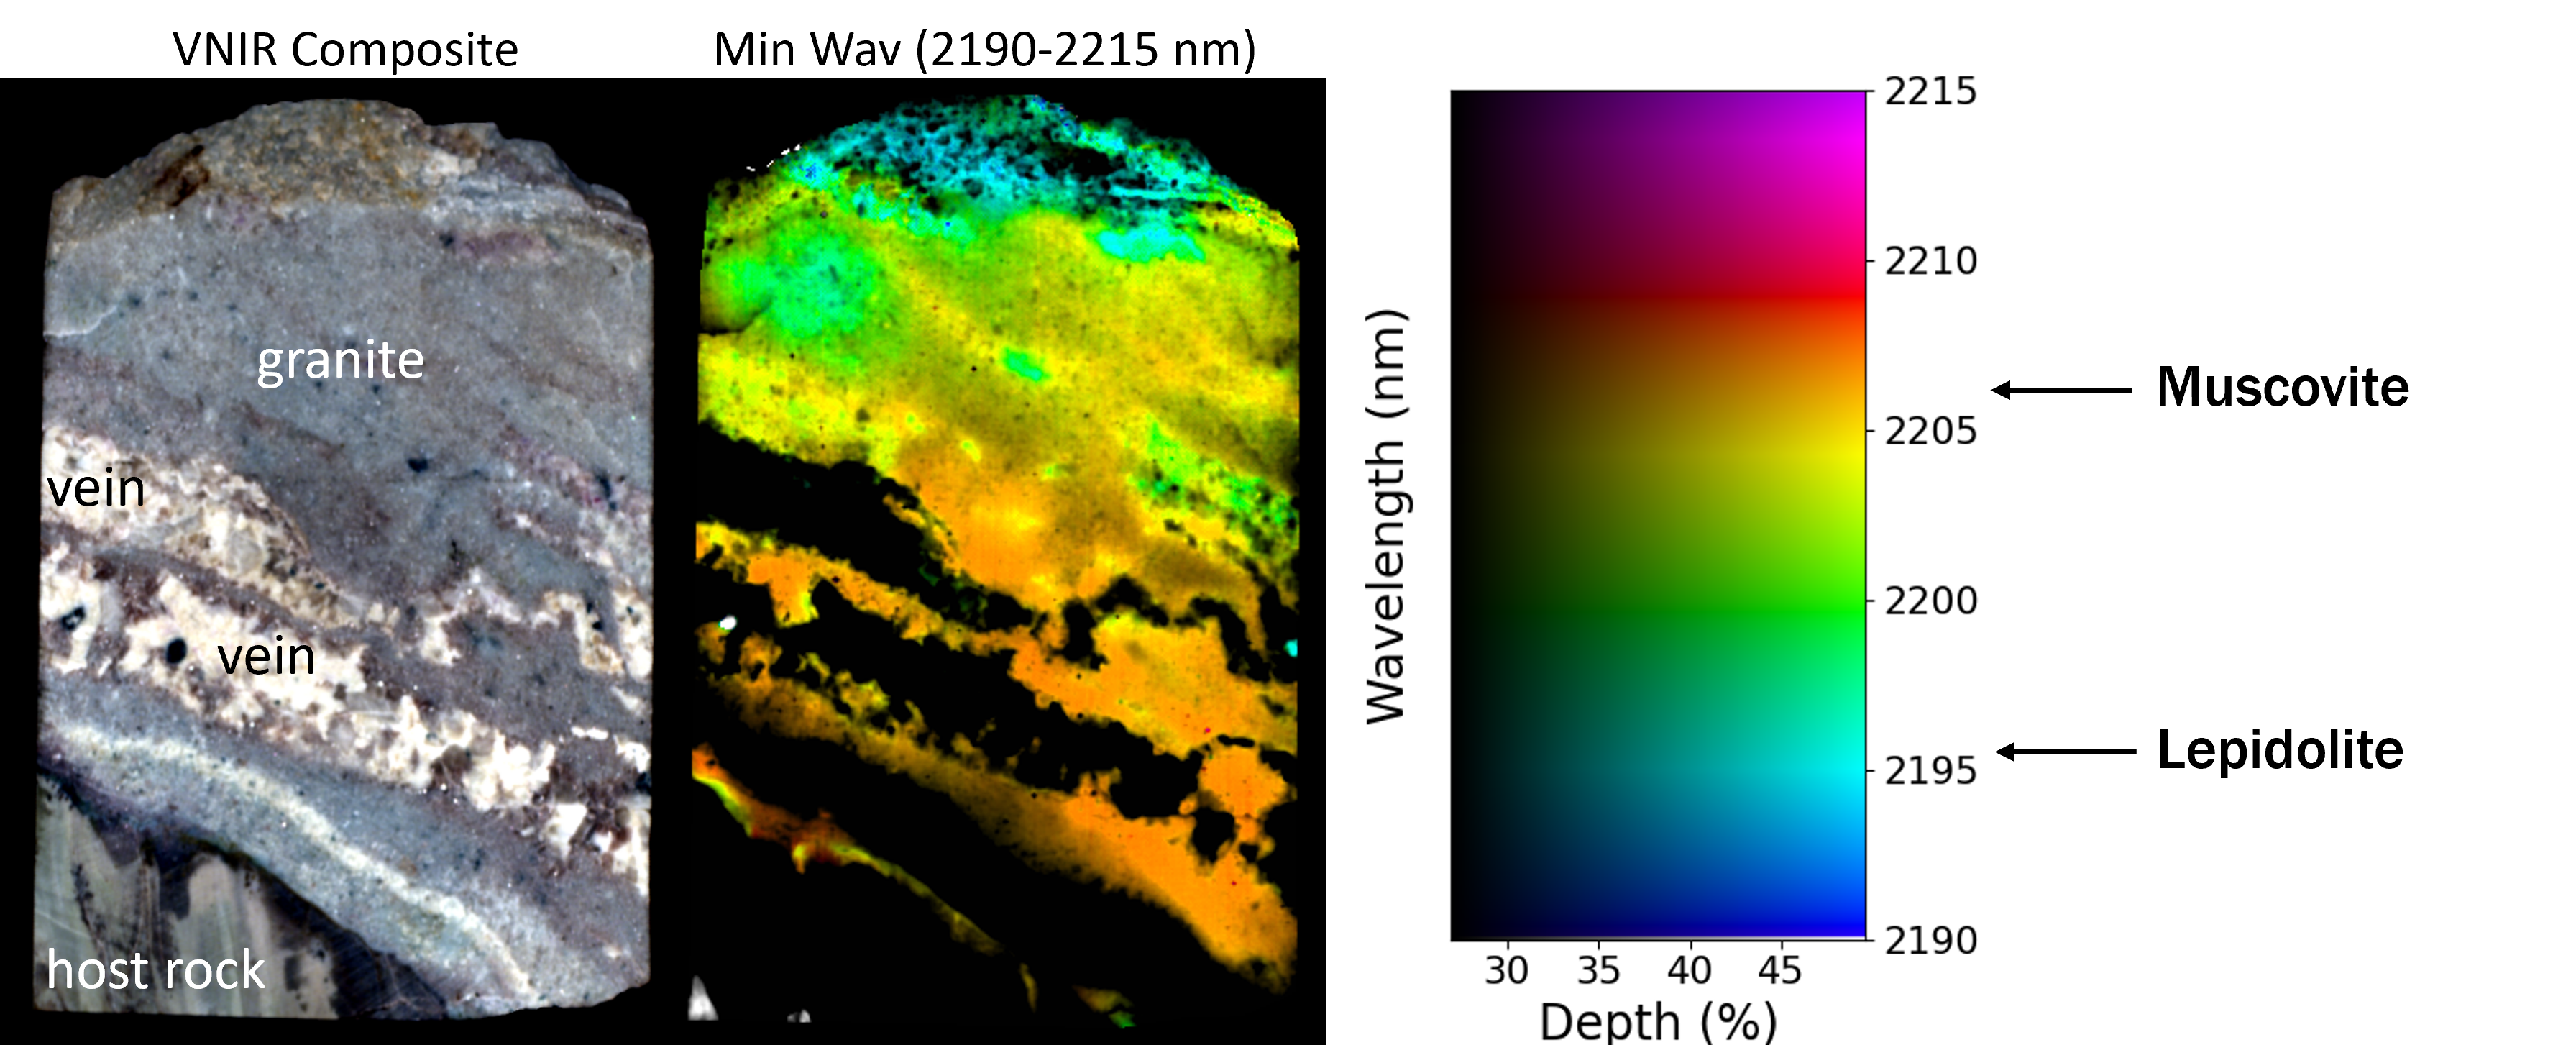
- Map them using hue (wavelength) and brightness (depth).
For this analysis I am using an open source software called Hyppy which are developed by the ITC Earth Science Labs in University of Twente. The result are shown in the image below.

In this image, the wavelength position of the deepest absorption feature is represented by hue, where the color blue indicating shorter wavelengths and purple indicating longer wavelengths. The depth of the feature is shown as brightness. Dark or black pixels correspond to areas where the OH feature is absent, meaning no white mica minerals are present. Several important observations can be made from this visualization. First, the occurrence of white mica minerals appears to be confined to the main body of the granite, and they are largely absent in both the surrounding veins and the host rock. Second, there is a clear spatial gradient in the wavelength position of the deepest absorption feature, shifting from longer wavelengths near the contact zone between the granite and the host rock, to shorter wavelengths deeper within the granite body. This pattern reflects a compositional transition in the white mica group, from muscovite at the margins to lepidolite in the granite core. This suggests that the original granite magma was already enriched in lithium, and interaction with the surrounding sedimentary rocks likely introduced additional aluminum—and possibly iron and magnesium—substituting for lithium in the octahedral sheets of the mica structure.
Classification
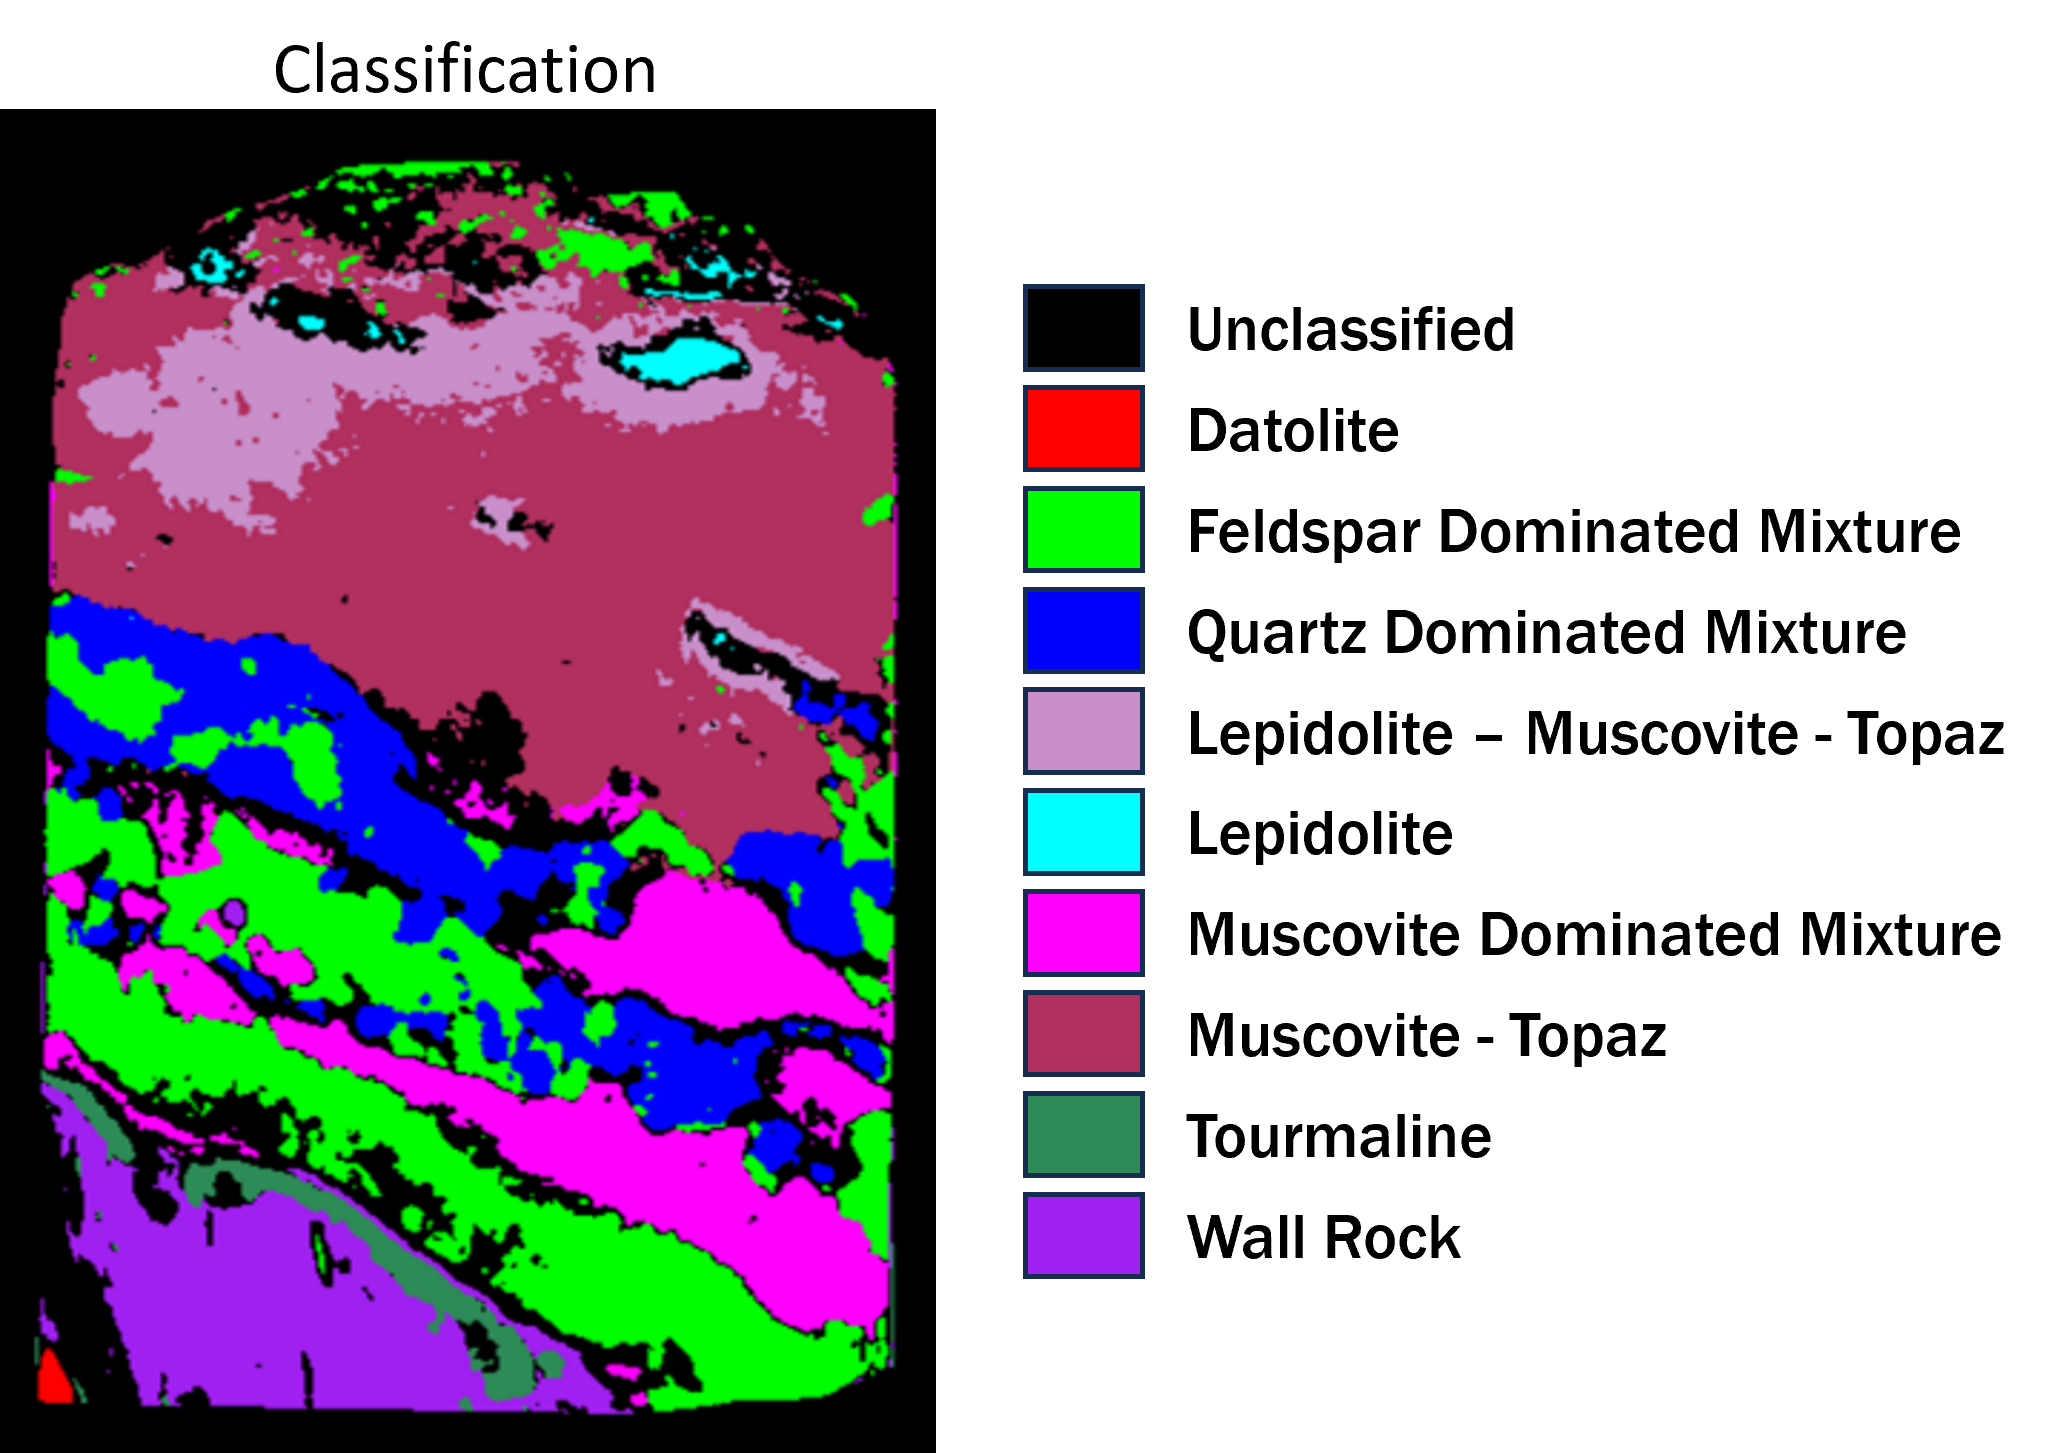
While minimum wavelength mapping offers rich insight, classifications help simplify the output. I applied a decision tree classifier to assign each pixel to one of 10 classes based on the absorption wavelength and depth values.

This case study highlights how HSI is a powerful tool for identifying lithium-bearing minerals through subtle spectral variations. By focusing on the spectral behavior of white micas, particularly shifts in the ~2200 nm absorption feature, we can non-destructively infer mineralogical variations linked to lithium content. The spatial resolution and continuous coverage offered by hyperspectral data enable detailed mapping of mineral zoning within core samples, providing valuable insight into the geological processes at play.
The spatial distribution of white mica species is valuable beyond lithium exploration, as different white micas can be associated with distinct temperature and geochemical conditions in hydrothermal systems, making them effective vectors toward ore bodies. One of the key advantages of HSI is its scalability: the same spectral analysis applied to core samples can be extended to outcrops and even regional scales using airborne or satellite platforms.
Enjoy Reading This Article?
Here are some more articles you might like to read next: