Sentinel-2 Bare Earth Mosaics
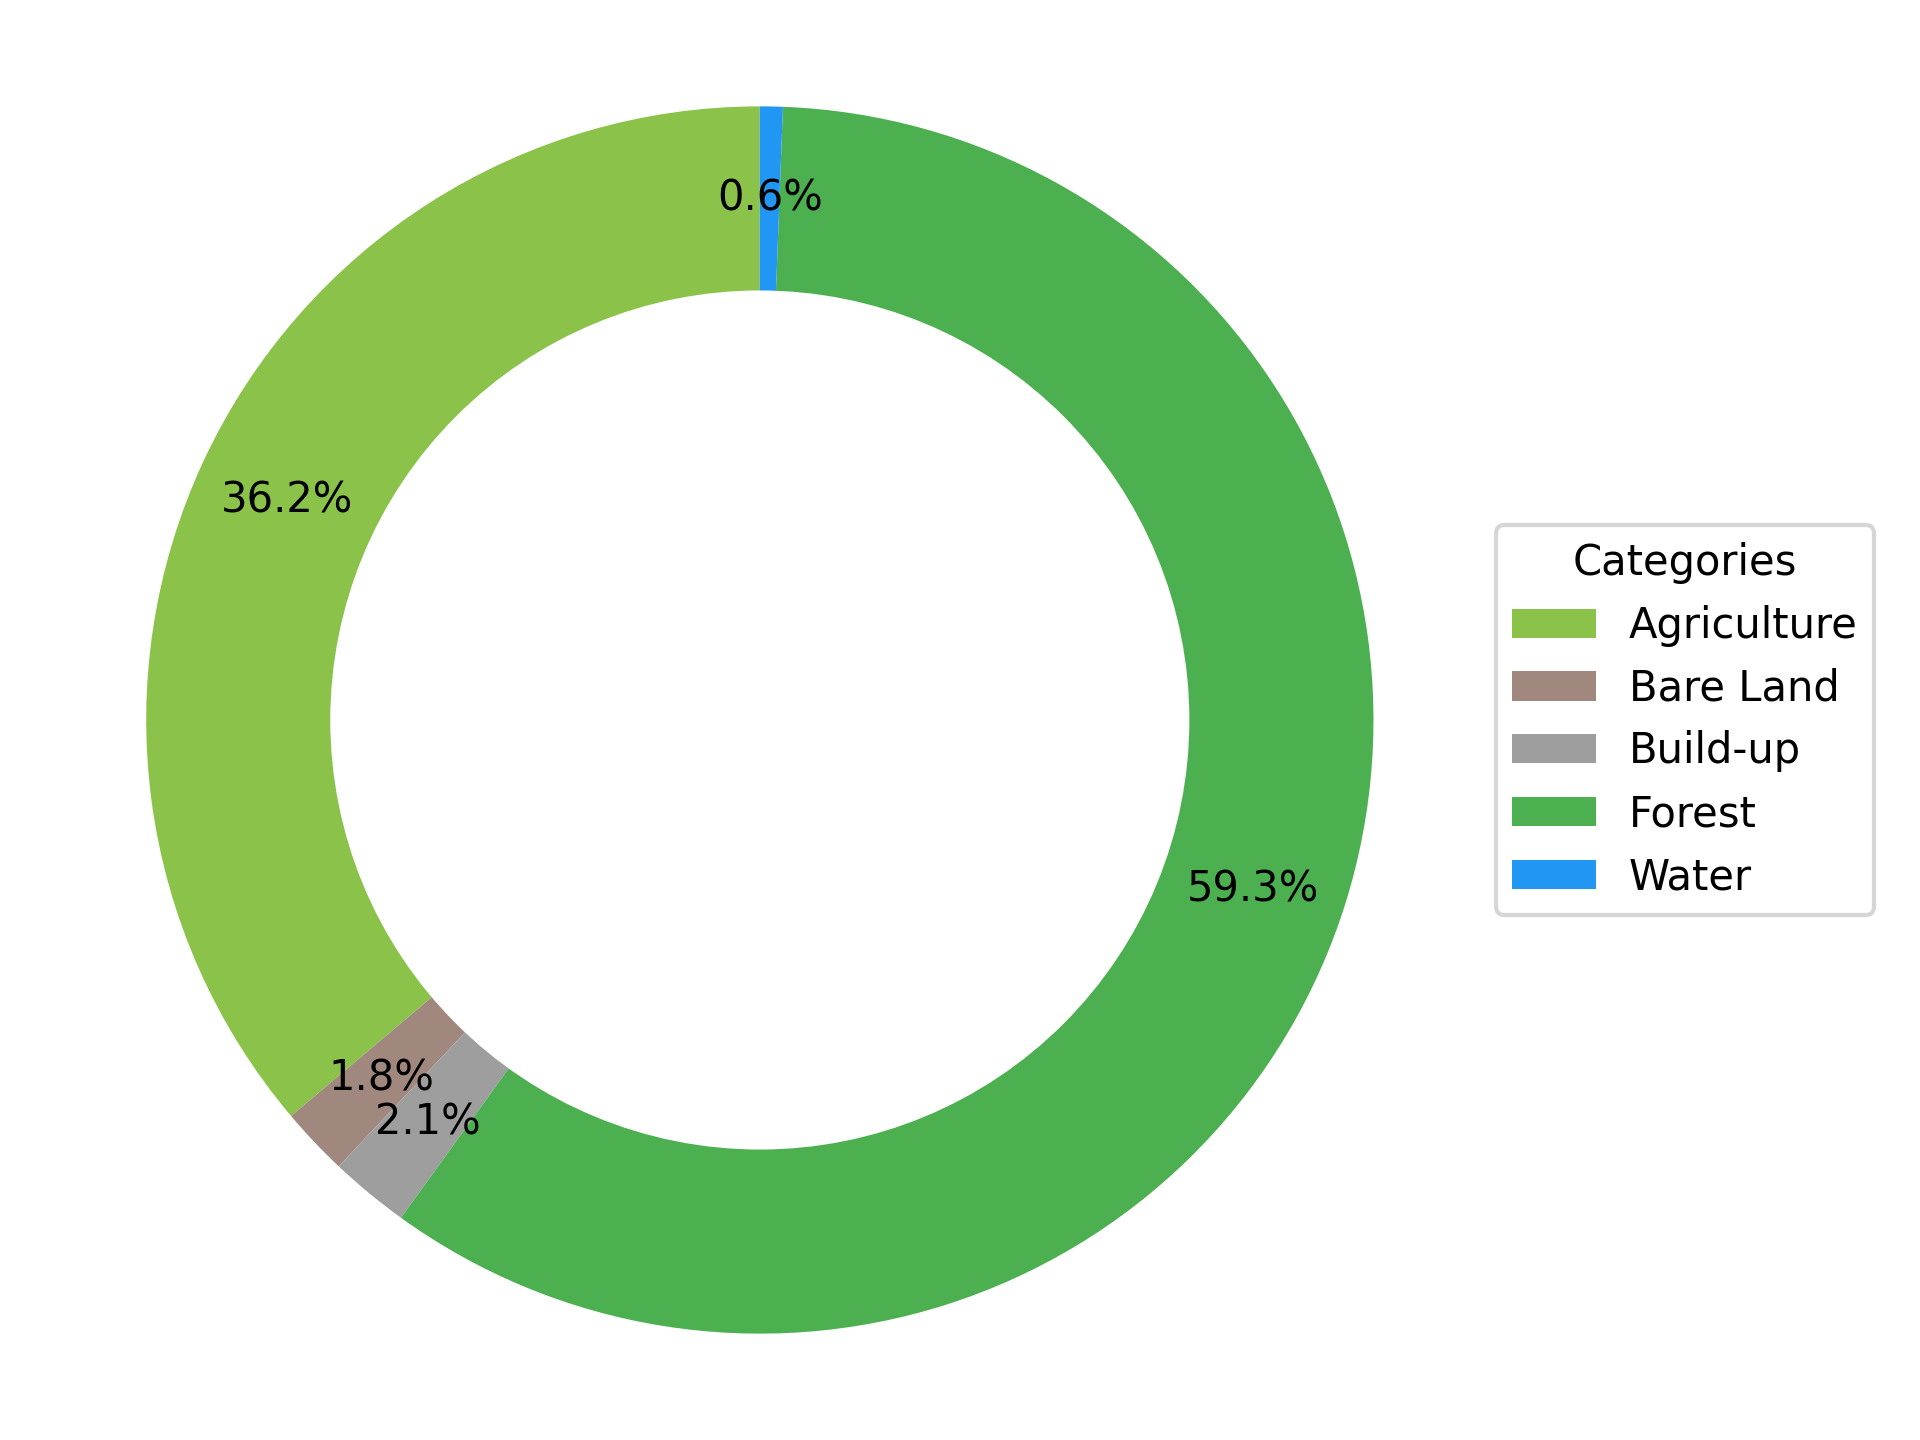
As a tropical country, Indonesia faces challenges in using optical remote sensing data for soil and geological analysis due to extensive vegetation cover. According to the Indonesia Land Use/Land Cover (LULC) Map of 2019, only 1.8% of the land is classified as bare land. However, a significant portion of vegetated area (38.2%) consists of agricultural land. During land use changes, particularly in the early stages of agricultural development, land clearing exposes the bare soil. Additionally, many agricultural areas follow cultivation cycles, periodically revealing the soil beneath.

By leveraging dense time-series satellite images, we can generate a bare earth mosaic, which combines pixels from different acquisition times to maximize the exposure of the ground surface. Geoscience Australia has created such maps for the entire continent using Landsat and Sentinel-2 images. Inspired by this, I recently experimented with a method to build a bare earth mosaic for Indonesia using Google Earth Engine.
Approach
This approach selects only the driest, non-vegetated pixels from the time-series collection while masking out permanently vegetated, wet, and built-up areas. The process involves:
-
Cloud Masking: Cloudmasking using s2Cloudless
-
Pixel Filtering: Using various spectral indices for vegetation, water, and soil to exclude unwanted pixels.
-
Geometric Median Computation: Calculating the geometric median of the remaining pixels to minimize noise and cloud contamination.
-
Final Masking: Removing residual built-up areas using LULC maps.
The resulting image is a bare earth mosaic, highlighting exposed soil and geological features. For visualization purpose, masked vegetation, water, and built-up pixels can be reintroduced.
Comparison with Standard Cloudless Mosaics
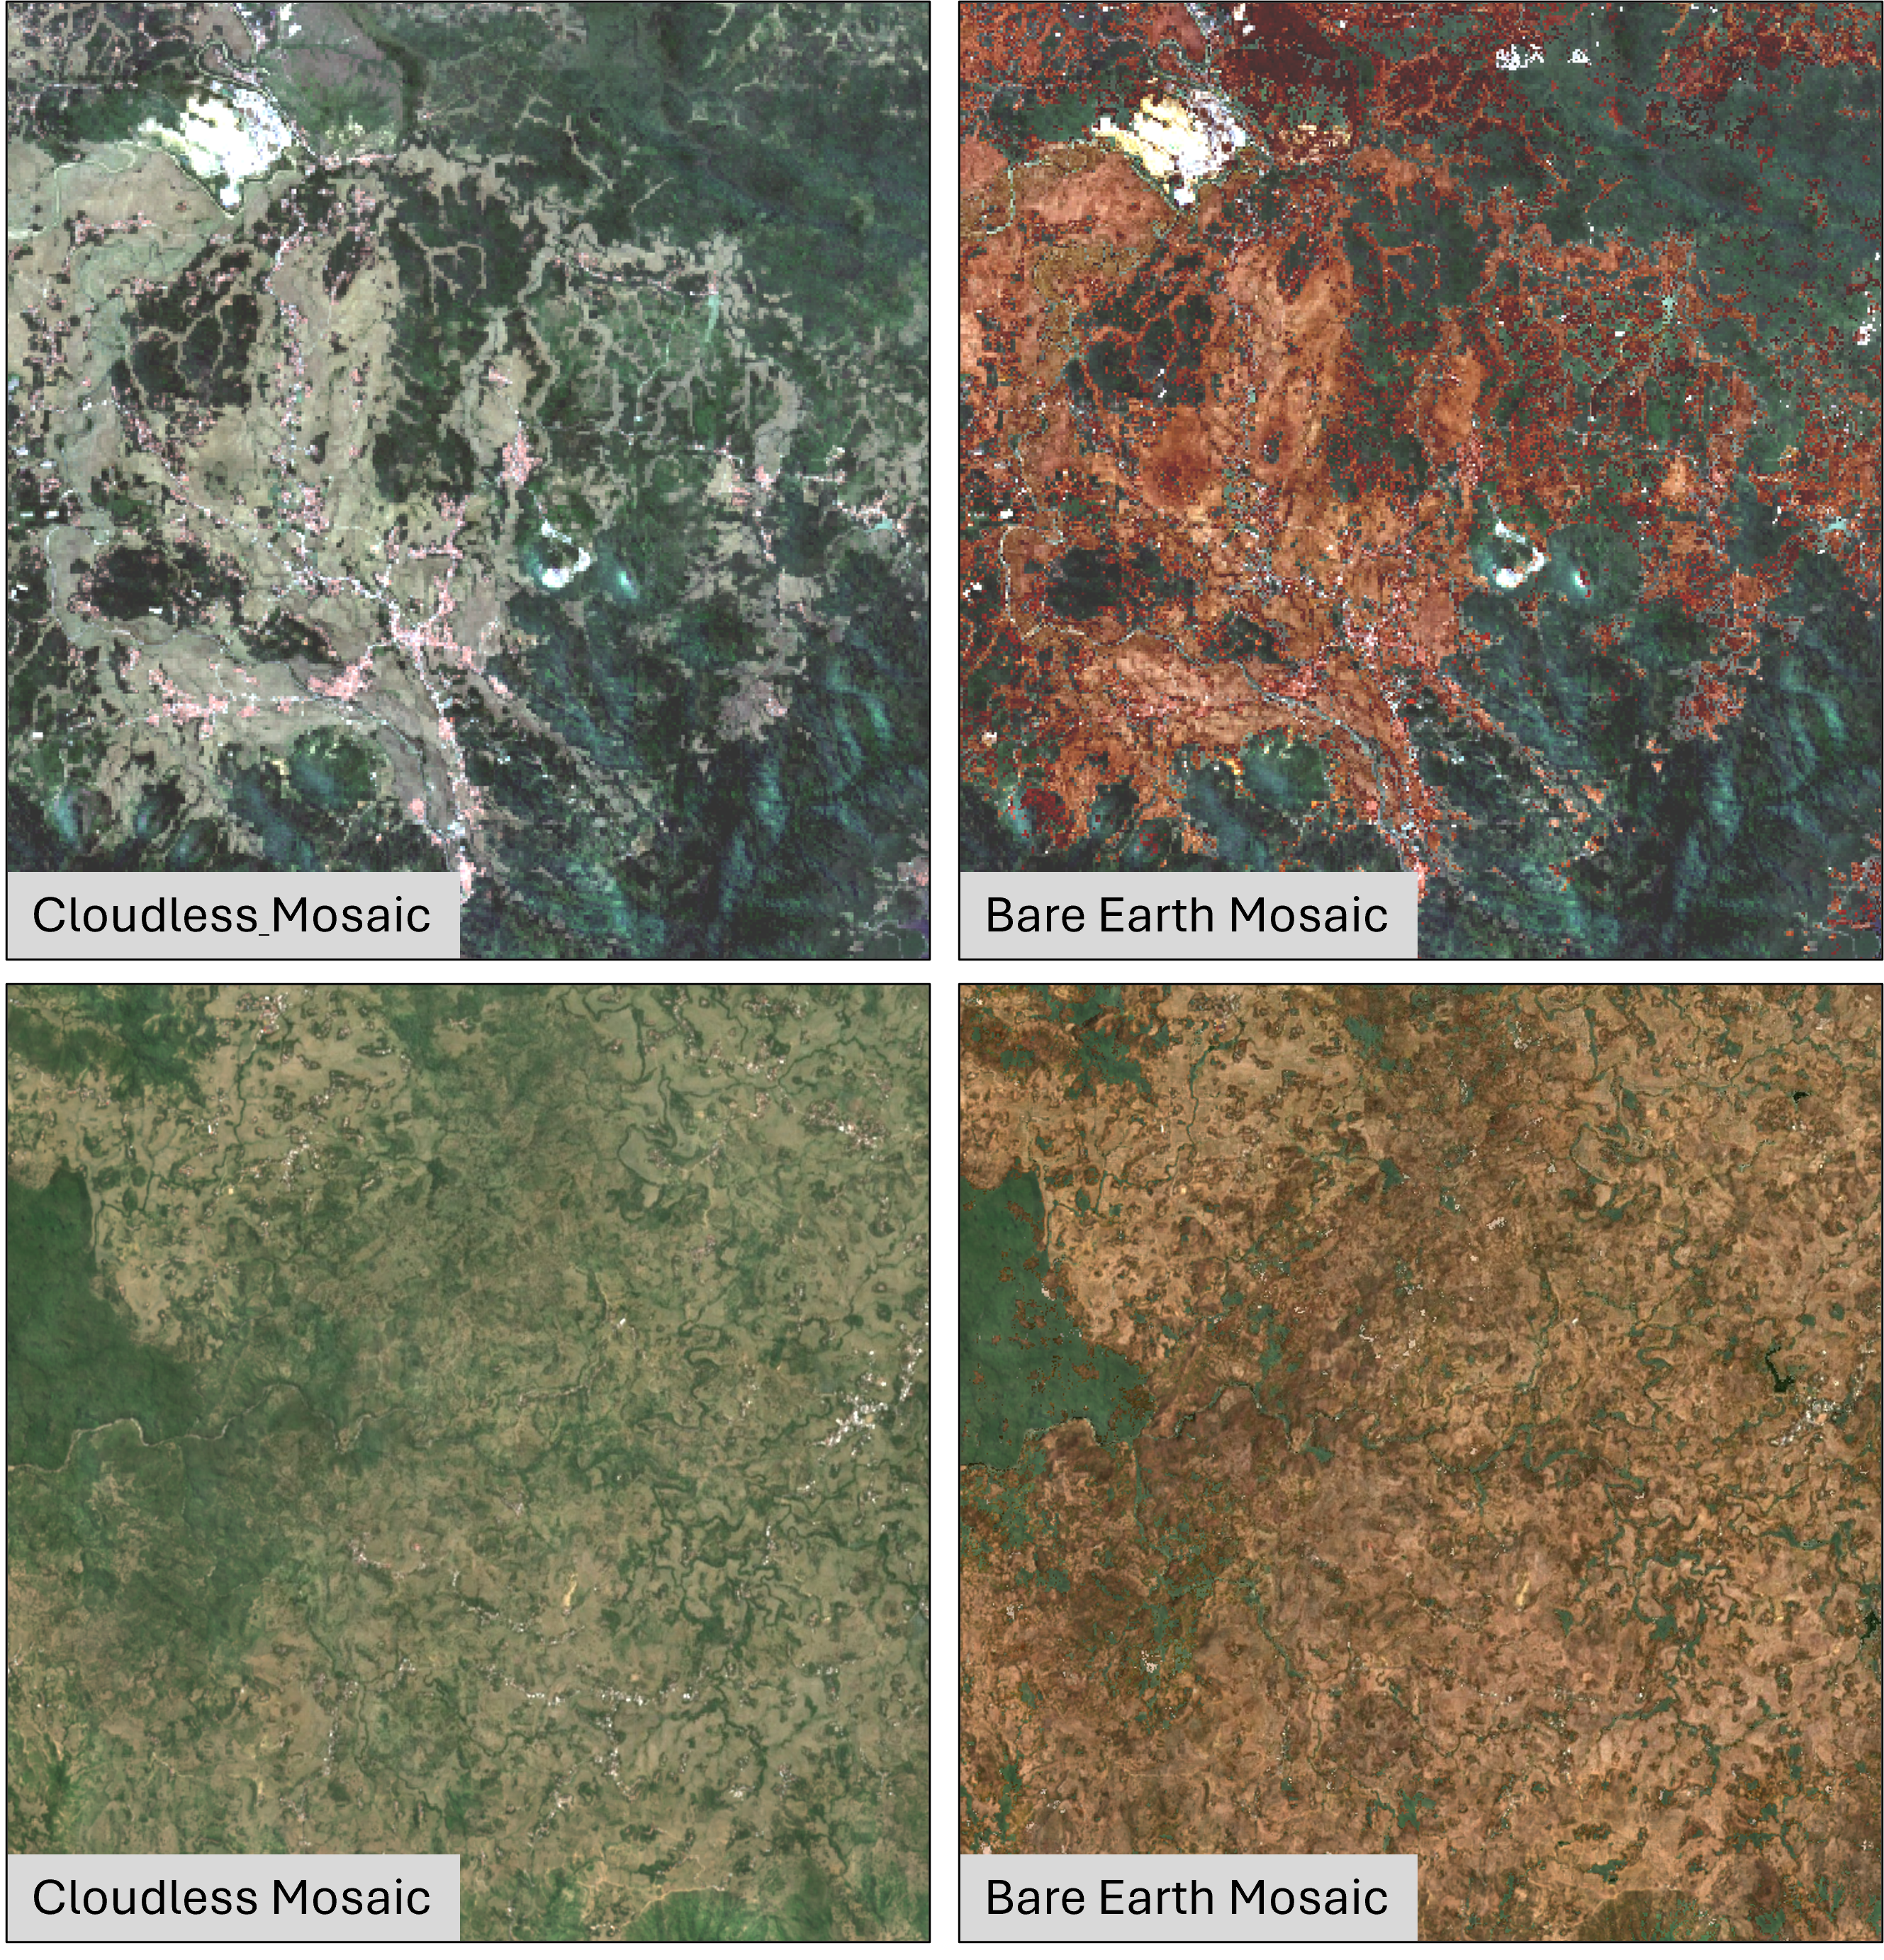
The images below compare a standard cloudless mosaic with a bare earth mosaic derived from Sentinel-2 images. The latter effectively selects the barest pixels within agricultural areas and built-up zones.

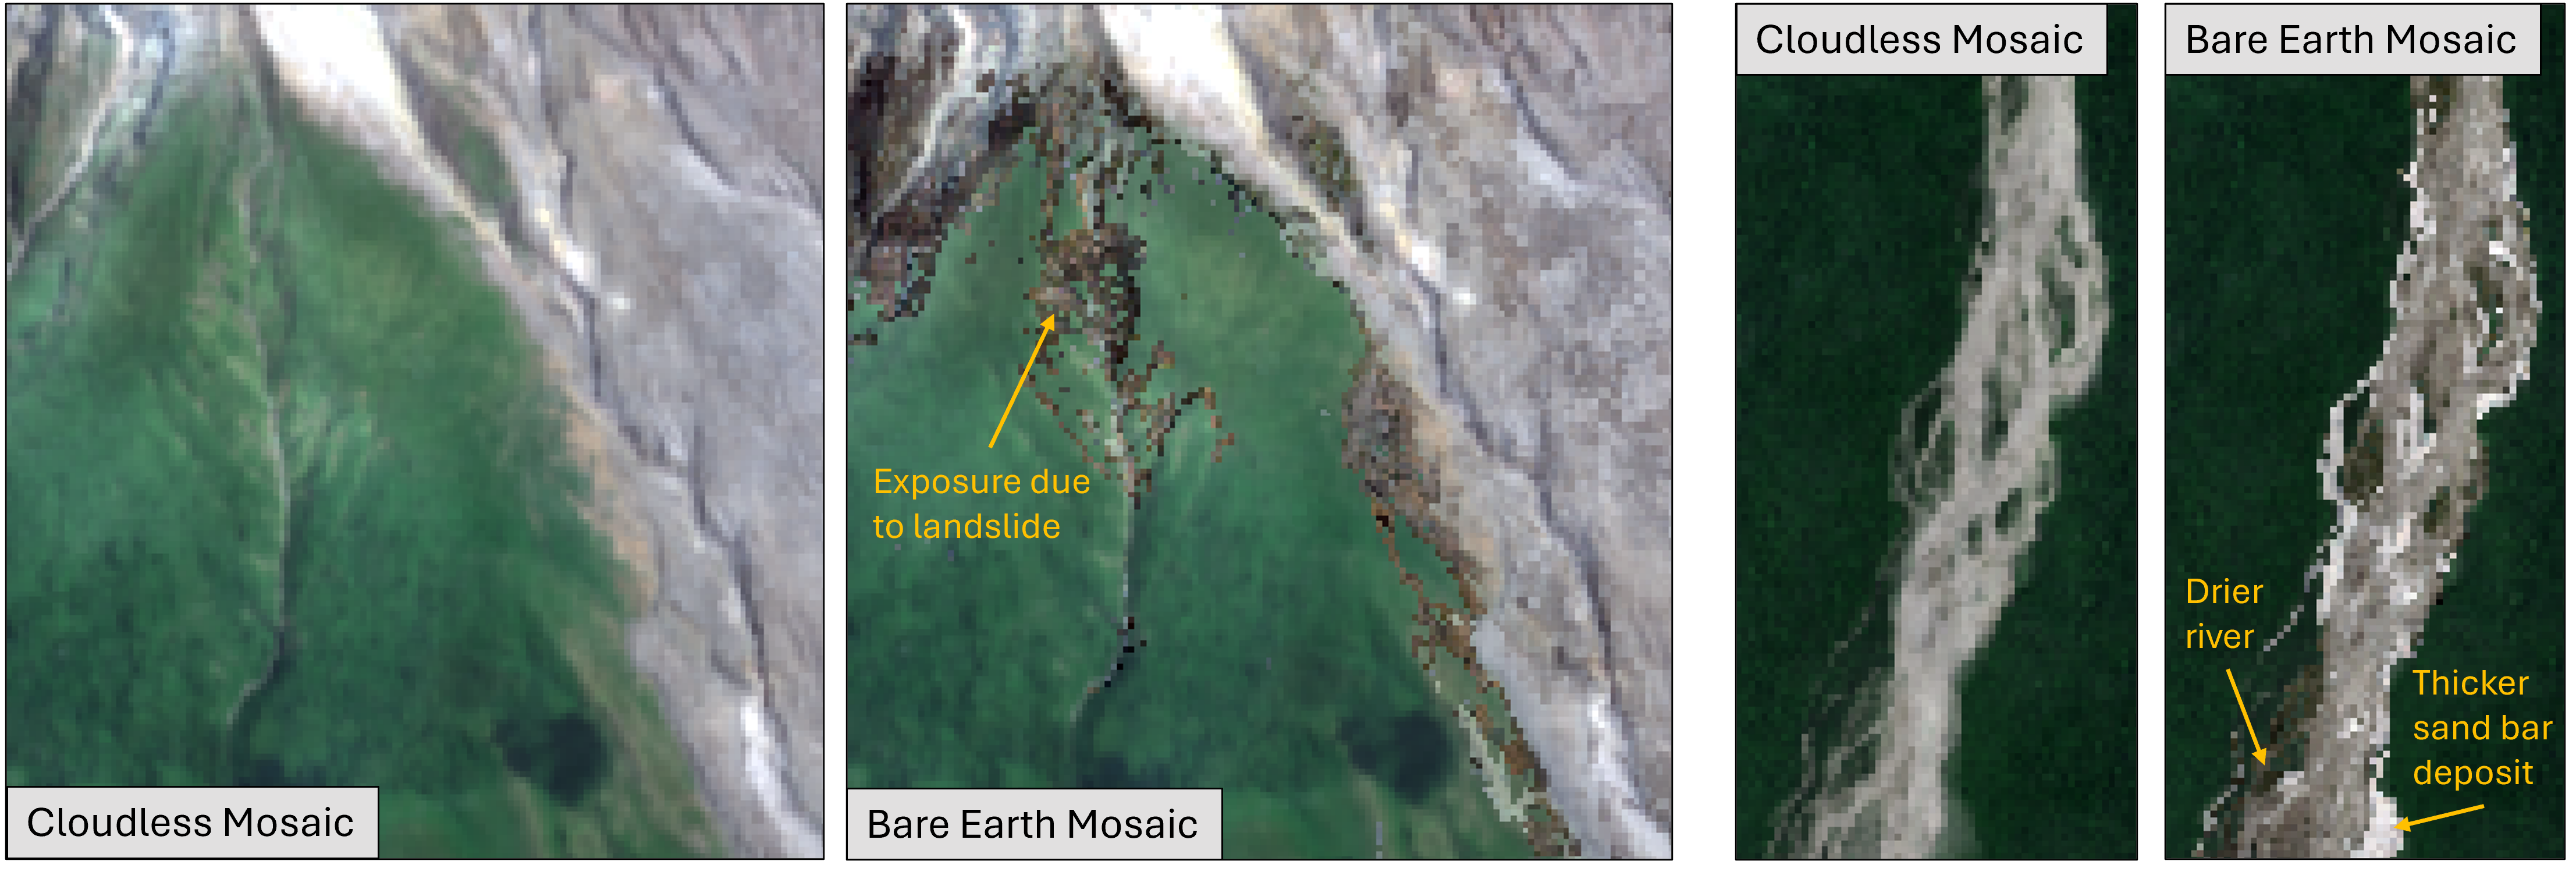
This method also reveals earth surfaces in permanently forested areas, such as landslide-exposed soil and sandbars in rivers during droughts or after heavy rainfall, when sediment is deposited.

Applications and Challenges
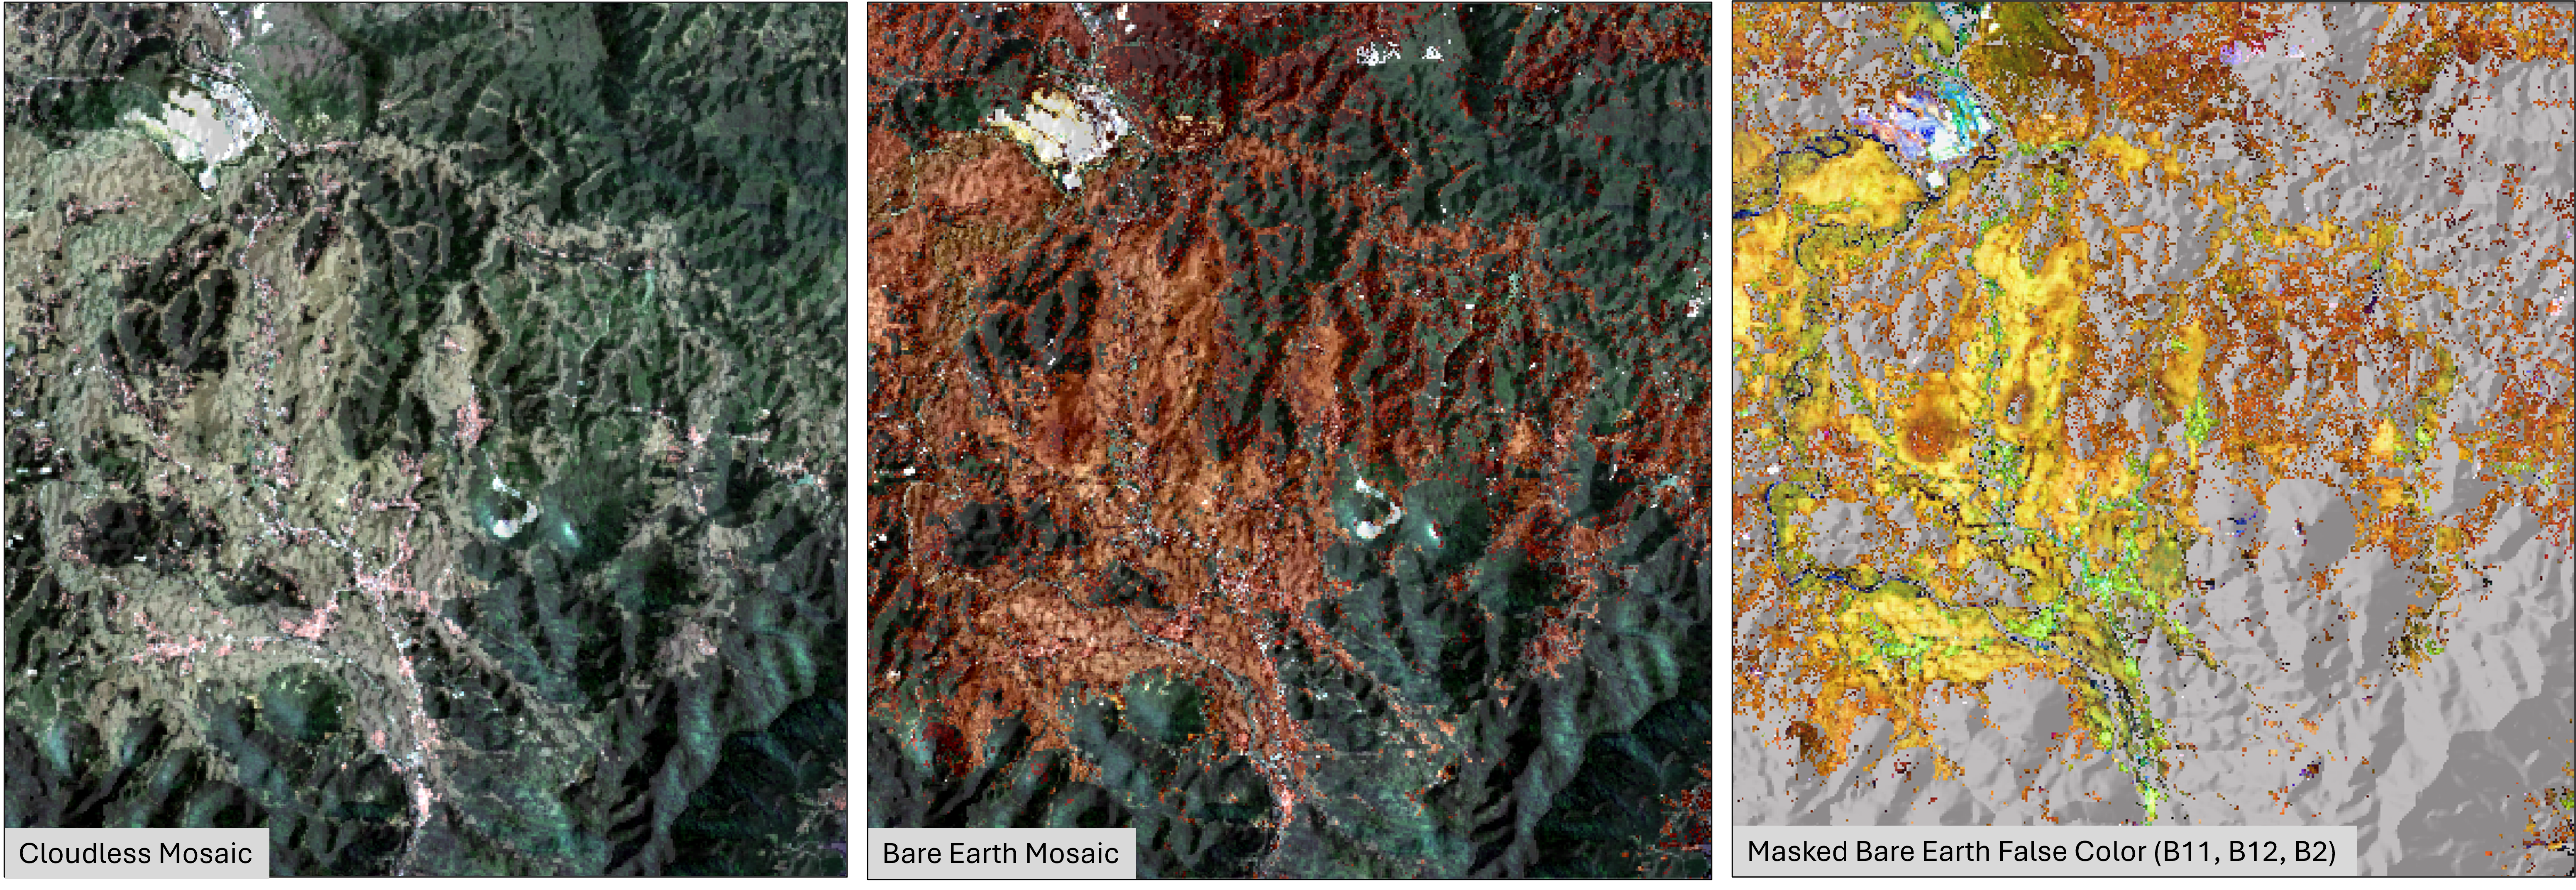
For further geological and soil analysis, it is best to use the masked image. For example in the image below, a simple false color-composite already show:
-
Soil composition variations in southern hills (greensih color), with some material transported north via river systems.
-
Differences between eastern (yellowish) and western plains (orange).
-
Distinct compositions within mining pits (very bright color).
This color composite highlight the potential of bare earth moscais for geological/soil analysis.

The main challenge in generating a nationwide bare earth composite for Indonesia is scalability. My current approach exceeds Google Earth Engine’s computational limits when applied at scale. To overcome this, I need to optimize the process or split the computation into hundreds of smaller patches.
This is an ongoing experiment, and I hope to refine the method further. If you have suggestions or insights, please feel free to share!
Enjoy Reading This Article?
Here are some more articles you might like to read next: