Endmember Extraction from Hyperspectral Imagery Using N-FINDR
Hyperspectral imagery often contains mixed pixels—pixels that represent areas with more than one class of interest. Given the complexity of the scenes, and the rigid structure of images, it is unrealistic to assume every pixel to correspond to a single class. These classes could include features like water, trees, shrubs, grass, soil, or roads when performing land cover classification using satellite or airborne imagery. In earth science, the class of interest often is minerals that forms rocks. In any way, trying to find the purest pixels , or endmembers, of each class in our image is something that often useful for further analysis.
In this post, I’ll provide a brief overview of one endmember extraction algorithm reffered to as N-FINDR. But, before diving into the details of the algorithm, it is important to acknowledge the general limitations of endmember extraction algorithms:
- Purity is not guaranteed: These algorithms don’t guarantee that the extracted spectra represent a pure spectra of specific class of interest. Instead, they identify the purest spectra present in the image.
- Known number of endmembers: The number of endmembers in the image must be known beforehand. This can be estimated using domain expertise, auxiliary measurements, other algorithms, or trial and error.
- Linear mixture model assumption: Most endmember extraction algorithms, including N-FINDR, assume a linear mixture model.
How N-FINDR Works
The core idea of N-FINDR is simple yet clever: it identifies the vertices of the simplex formed by the data distribution in reduced dimensions. These vertices are the purest spectra present in the dataset. The general steps of the algorithm is as follows:
- Reprojection: Reproject all pixels into a lower-dimensional space using an orthogonal transformation like Principle Component Analysis (PCA) or Minimum Noise Fraction (MNF). MNF is often preferred because it minimizes the influence of noise.
- Dimensionality reduction: Reduce the dimensionality to the first \((n−1)\) components, where \(n\) is the number of endmembers. At this stage, the data points should lie inside an \((n-1)\) dimensional simplex.
- Iterative vertex selection:
- Randomly select \(n\) points and calculate the simplex’s volume (or area in 2D).
- Iteratively replace one vertex with another pixel. If the new simplex’s volume is larger, accept the replacement. Otherwise, reject it and try again.
- Termination: After a fixed number of iterations without improvement, the algorithm terminates, and the final set of pixels is taken as the endmembers.
- Reprojection back: Reproject the selected pixels into the original dimensional space to obtain the endmember spectra.
Synthetic Data Example
To illustrate, let’s consider an idealized case of 1,000 synthetic mixed pixels generated from three endmembers. Since we’re dealing with three endmembers, we reproject the data into its first two principal components. In this reduced space, the data points lie perfectly on a 2D simplex—a triangle as shown in the image below:

If each data point is a linear mixture of three pure endmembers, the endmembers will be located at the vertices of a triangular region, commonly referred to as a simplex. In this 2D example, identifying the simplex is relatively straightforward through visual inspection. However, as the number of endmembers increases, the dimensionality of the principal component representation also grows, making it increasingly difficult to determine the simplex visually. To overcome this challenge, we employ an iterative simplex-finding algorithm, which can be generalized to handle higher-dimensional data. The animation below illustrates the iterative process of refining the simplex:
Real Data Example
In real-world scenarios, hyperspectral data is rarely as ideal as synthetic examples. Complex noise, non-linearities, and other factors often result in an imperfectly formed simplex. Nevertheless, algorithms like N-FINDR can still provide valuable output.
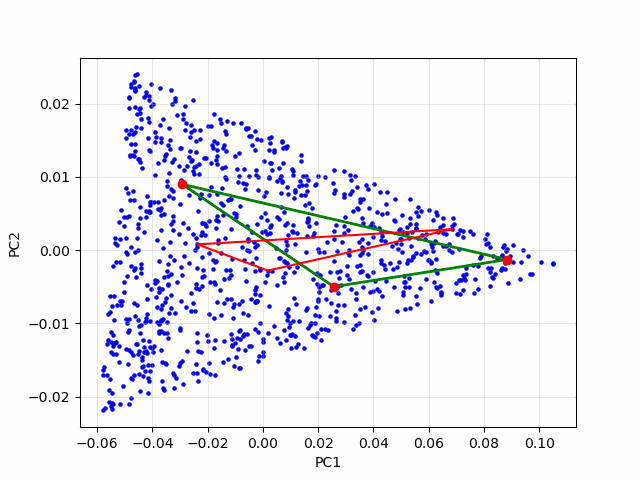
For this example, we examine laboratory-acquired hyperspectral imagery of a sandstone sample. Below is a false-color composite image of the sample:

A quick inspection of the rock suggests that it is predominantly composed of three minerals. Thus, we assign \(n=3\) for this analysis. The results of the MNF transformation and the selected simplex vertices by N-FINDR are shown below:

Notice that the simplex is not perfectly formed, and the triangular structure appears slightly distorted. This suggests minor non-linear behavior in the actual mixtures. Additionally, some outliers lie outside the simplex, possibly influenced by accessory minerals. Such minerals, often present in small amounts, are common in natural rock samples and can affect the spectra of certain pixels. These influences may not be fully captured in a 2D representation.
We can examine the spectra of the selected purest pixels by transforming them back to their original dimensions. Below are the resulting spectra for the three identified endmembers:

If you know your mineralogy and infrared spectroscopy you can immedietly recognize these minerals. The red spectra have a strong absorption feature in ~2200 nm region which related the \(Al-OH\) bonds of white mica/clay mienrals. The blue spectra have an absroption feature in ~2330 nm region related to \(CO_3\) bonds of carbonate minerals. The green and bright spectra represent quartz mineral. we still can see a very weak feature in ~2200 nm sugest that it is not 100% pure spectra and there is still a small influence of clay minerals.
While these spectra are not perfectly pure, they are sufficiently representative to be useful for further analysis. For instance, as shown in our previous post, we used these endmember spectra for spectral unmixing and achieved excellent results, with an RMSE of only 0.0186.
To understand the spatial context, we can reshape the extracted data back into its original image structure to visualize the locations of the purest pixels:
This example shows that N-FINDR is a powerful and intuitive algorithm for endmember extraction. Despite its limitations, such as the need for prior knowledge of the number of endmembers and the assumption of a linear mixture model, it often still provides a usefull results.
Enjoy Reading This Article?
Here are some more articles you might like to read next: