Using Raster Calculator in QGIS GUI and Python Console to Make SR Blocks
Raster Calculator is a robust way to execute a map algebra operation on raster image(s) using a user-friendly calculator-like format. It is a commonly available feature on any GIS software such as ArcGIS and QGis. Raster itself is one of the commonly used data formats in GIS which stores data in cells or pixels and organizes it into rows and columns (position) and each cell or pixel contains a value that represents certain information (visualized as colors). We can use a raster calculator to exploit these array-like properties of raster data to run any map algebra operation on each pixel in a robust way.
The benefit of calculating SR in a raster calculator, rather than in any build-up function that your software already provides, is the flexibility of the operation that you can run. Now today we will try to perform a calculation to generate raster data containing a stripping ratio value of each pixel area given the topographic elevation data, and roof and floor elevation of each seam (we will use two seams for this example, let’s name it Seam A and Seam B).
Raster Calculator with QGIS GUI
Data Preparation
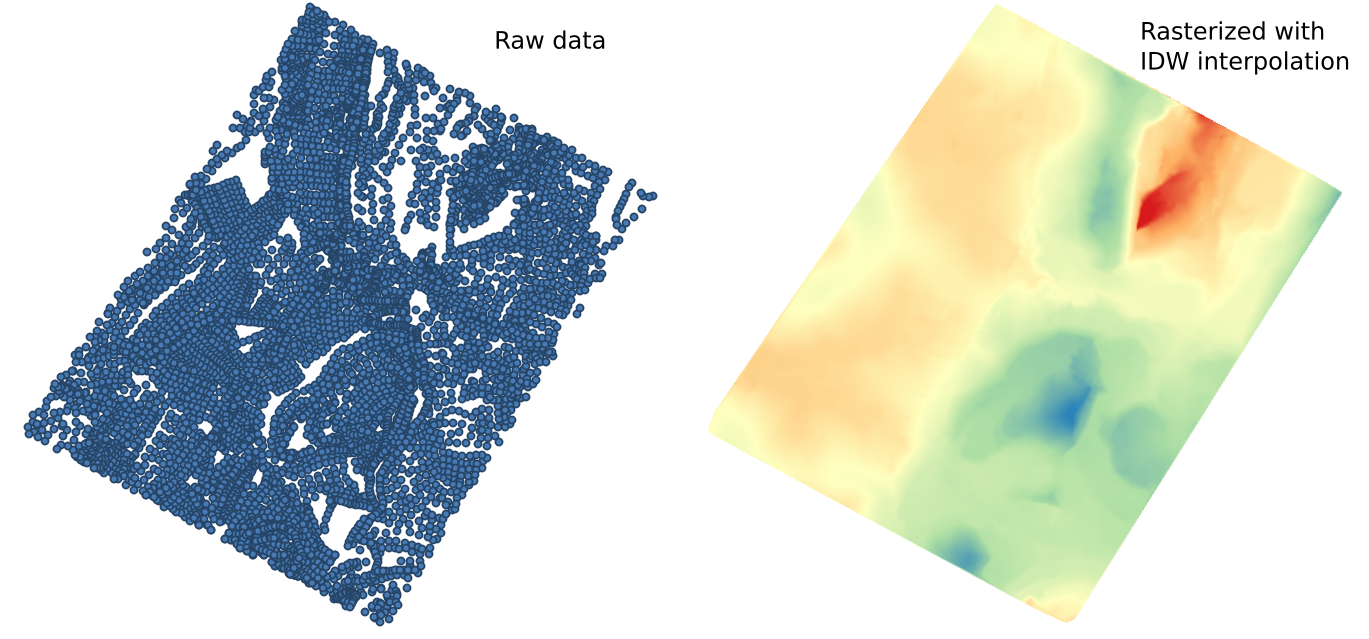
Readily available raw elevation data is usually stored in a vector format of in [x,y,z] point text format; so first, we need to convert our data format. If our points data are already in a grid structure, we can perform conversion directly with vector to raster which in QGIS can be found in Raster>Conversion>Rasterized(Vector to Raster). If our data point is not neatly and densely structured then it becomes an interpolation problem. There are a lot of interpolation methods that we can pick, depending on our initial data and our desired products. For this purpose, I will use IDW Interpolation that in QGIS can be found in **Processing>Toolbox>Interpolation>IDW Interpolation **. Below is an example of IDW interpolation from my topography data.
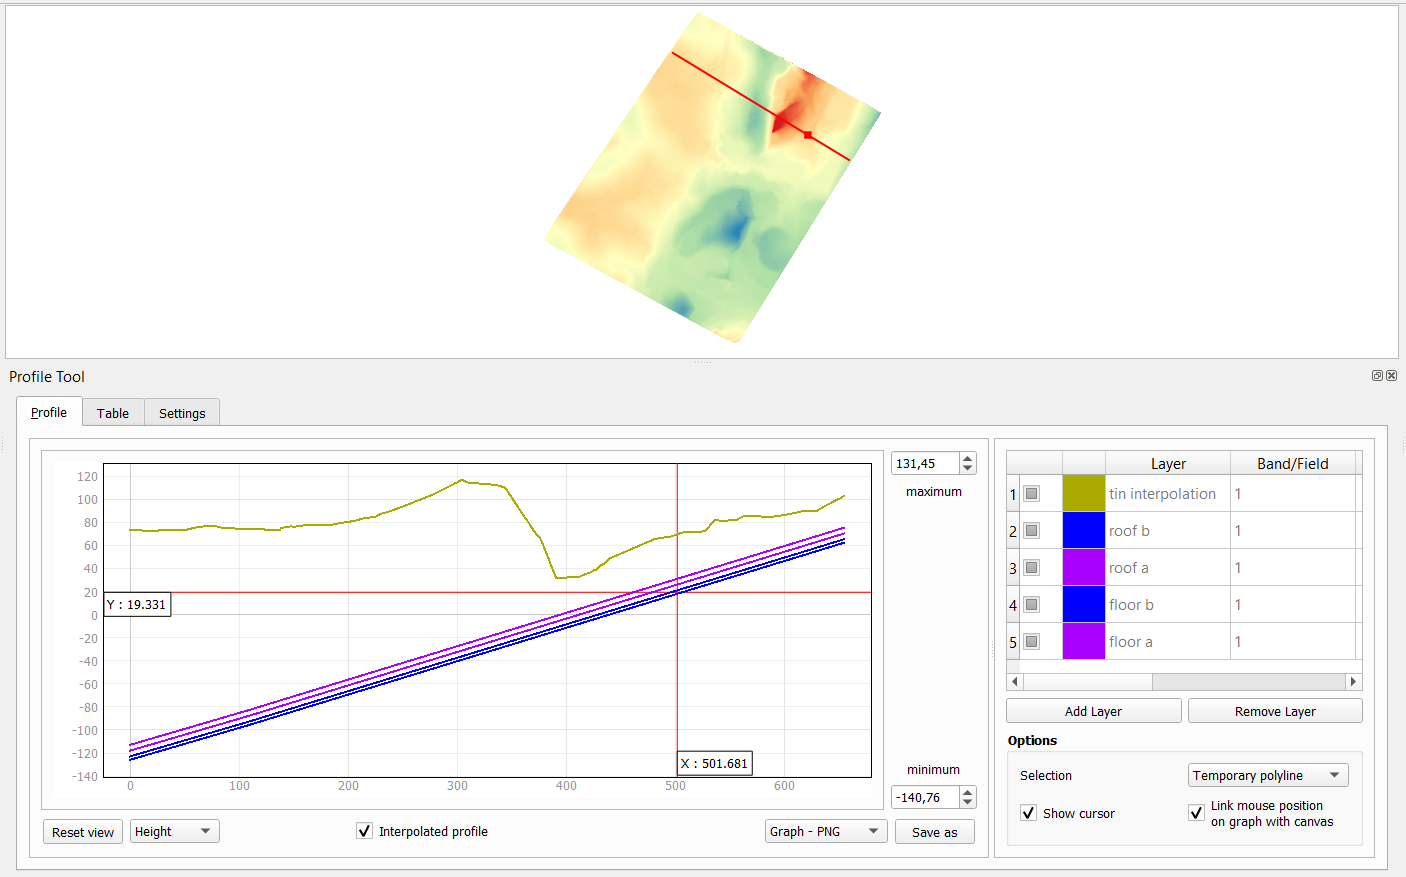
After all our data layers are ready in raster format, it is always a good idea to check the relationship of our datasets to get a better feel of what we are dealing with, for this example, we will try to make quick cross-sections. There is a very useful plugin in QGIS that I like to use to make a cross-section called Profile Tool. You can install this plugin in Plugins>Manage and install plugins… and search for Profile Tool in the search bar. In our data example today, we can see that we have two seams with pretty simple geometry that have a northwest dip direction.
Using Raster Calculator
After all of our data are ready in raster format, we can start to write our expression in the raster calculator. First, open up the raster calculator in Raster>Raster calculator…. The GUI of the raster calculator is pretty straightforward and easy to get used to. every operation, variables, field, layer, etc are stored in the graphic interface so we can just write in using our mouse if we want. raster calculator syntax is based on map algebra, which is basically an easier-to-read type of algebra.
now if we want to make SR blocks, first we have to figure out the expression to calculate it. The simplest definition of SR is just the ratio between overburden and coal or any other valuable material of interest, both on its respective cost units. In this example, it is the ratio between overburden in bulk cubic meters (bcm) to coal in ton.
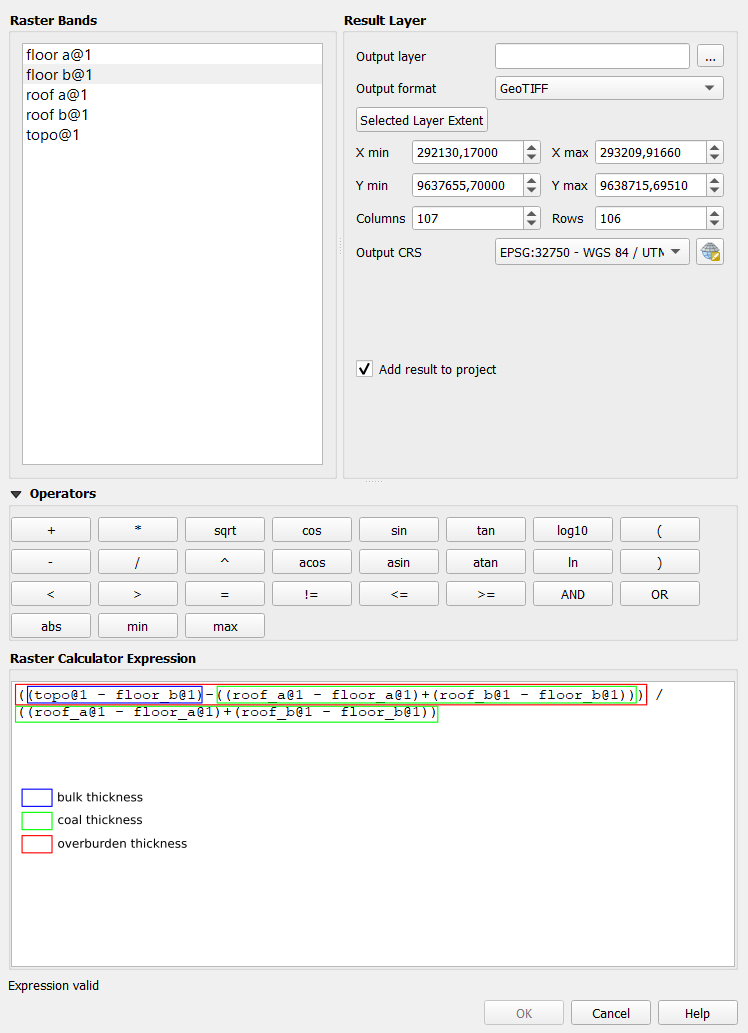
We can specify the resolution of our output raster by filling the column and row input with this formula:
- Column = (Xmax-Xmin)/desired resolution
- Row = (Ymax-Ymin)/desired resolution
There is a good text indicator at the bottom of the window that tells us whether the expressions that we put are valid or invalid. If the expression is valid, then we can proceed and press OK, if it is invalid, then we need to check and fix our expression.
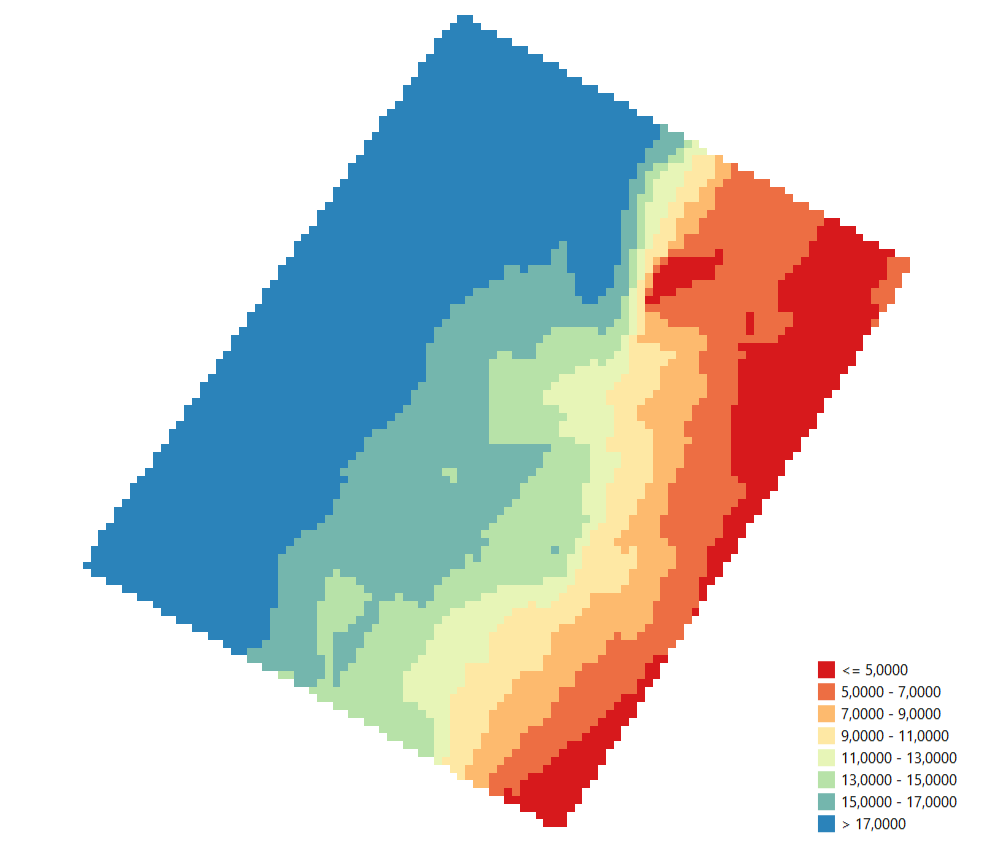
Below is the results of our calculation above after I adjusted the Legends in layer properties.
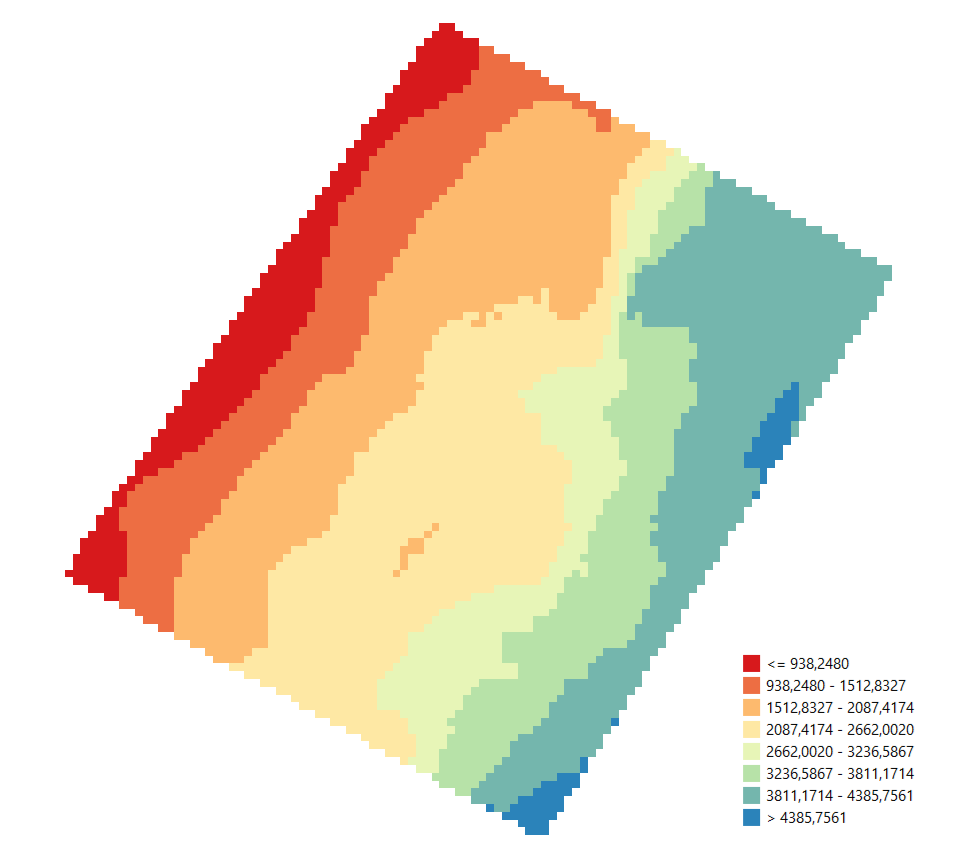
After we are familiar with how the raster calculator works, we can run any expression that we want, for our next example, We will try to calculate operating income blocks by subtracting operating cost from revenue.
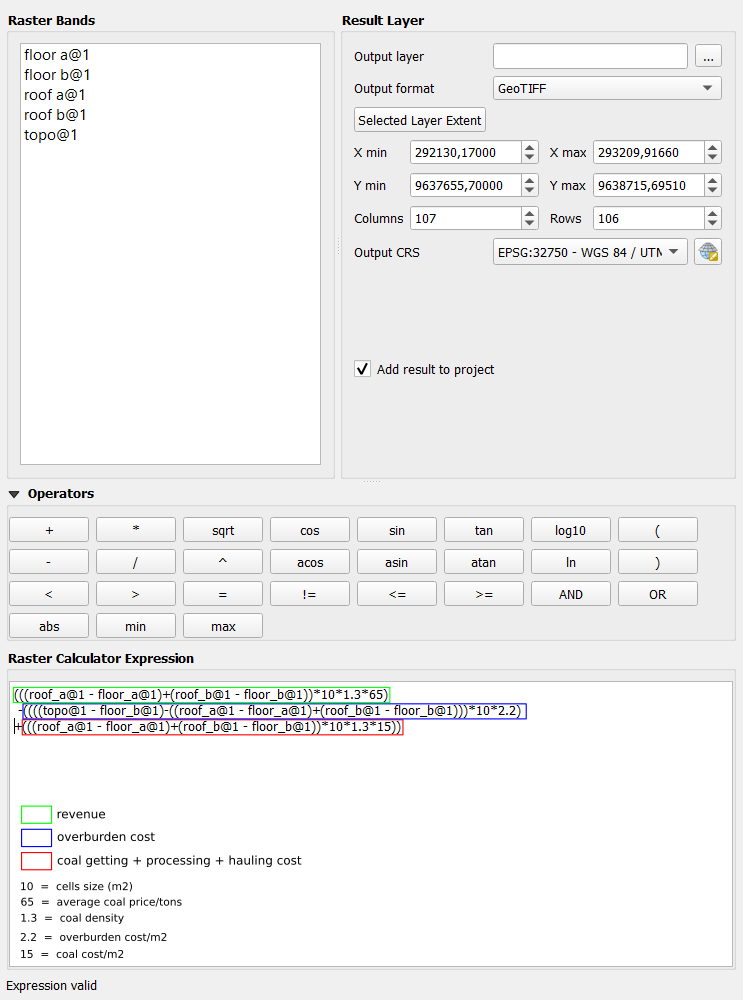
This is the result of that operation:
Using Raster Calculator in QGIS Python Console
You can press Ctrl+Alt+P to open your QGIS python console. This code below will do just about the same as what we did previously in Qgis GUI, but with less clicking and layer rendering, and it’s reusable for your future needs. It is especially useful if you are experimenting with various expressions and input since you can tweak it much faster and easier. You can even modify this code a little bit and write a loop that will execute various expressions and save each of the results into different output files.
If you want to reuse this code below you need to change the path and output variable, and all the parameters inside QgsRasterCalculator depending on your needs.
import os

path='C:/test/'
os.chdir(path)
file_list = os.listdir(path)
lyr_dict={}
for file in file_list:
    if '.tif' in file:
        file_name=file[:-4]
        layer_dict[file_name] = [QgsRasterLayer(path+file), file_name+'@1']

output = path+'block_SR.tif'
entries = []

for lyr in lyr_dict:
    ras = QgsRasterCalculatorEntry()
    ras.ref = lyr[1]
    ras.raster = lyr[0]
    ras.bandNumber = 1
    entries.append(ras)
    index+=1

calc = QgsRasterCalculator('(((roof_a@1 - floor_a@1)+(roof_b@1 - floor_b@1))*10*1.3*65)\
                           -((((topo@1 - floor_b@1)-((roof_a@1 - floor_a@1)+(roof_b@1 - floor_b@1)))*10*2.2)\
                           +1.135*(((roof_a@1 - floor_a@1)+(roof_b@1 - floor_b@1))*10*1.3*15))',
                           output, 'GTiff', topo.extent(), int(topo.width()/10), int(topo.height()/10), entries)
calc.processCalculation()
Here is a quick breakdown of the code above:
import os

path='C:/test/'
os.chdir(path)
file_list = os.listdir(path)
lyr_dict={}
for file in file_list:
    if '.tif' in file:
        file_name=file[:-4]
        layer_dict[file_name] = [QgsRasterLayer(path+file), file_name+'@1']
this code block will work to open up every raster (.tif extension) file in your working directory, so be sure to put all your needed raster files into one directory. After that, the loop will write those files into a layer dictionary. The dictionary will contain the name of the file without its extension as a key and its QgsRasterLayer class and names (which is the file name + ‘@1’). This is the naming convention for a raster layer in which the number after ’@’ specifies the number of bands that the raster contains (in our case it is 1).
output = path+'block_SR.tif'
entries = []

for lyr in lyr_dict:
    ras = QgsRasterCalculatorEntry()
    ras.ref = lyr[1]
    ras.raster = lyr[0]
    ras.bandNumber = 1
    entries.append(ras)
    index+=1
In this block, we are using a QgsRasterCalculatorEntry class reference to create a list entry for every layer and its attributes such as naming reference, raster layer variable, and its band number from our lyr_dict dictionary. After that, we put all of our QgsRasterCalculatorEntry classes into a list called entries.
calc = QgsRasterCalculator('(((roof_a@1 - floor_a@1)+(roof_b@1 - floor_b@1))*10*1.3*65)\
                           -((((topo@1 - floor_b@1)-((roof_a@1 - floor_a@1)+(roof_b@1 - floor_b@1)))*10*2.2)\
                           +1.135*(((roof_a@1 - floor_a@1)+(roof_b@1 - floor_b@1))*10*1.3*15))',
                           output, 'GTiff', topo.extent(), int(topo.width()/10), int(topo.height()/10), entries)
calc.processCalculation()
This is where the actual calculation occurs. QgsRasterCalculator takes the following parameters to run:
- expression: which can be any expression you like, written in string format
- output file path also in string. Be sure to specify the extension behind the file name
- output format which is also in string. The most commonly used file format is GTiff for .tif file
- the extent from the output file which is usually the same as the input extent, or any numbers depending on your needs
- nrows and ncols which define the total number of rows and columns on a given extent. For this example, since I want a 10-meter resolution raster as output and I have a 1-meter resolution for the input, I just divided my input height and width by ten
-
entrieslist
Afterward, you can execute your calculation by using processCalculation( ) function from QgsRasterCalculator. And the results will be the same as with our example using the GUI above.
Enjoy Reading This Article?
Here are some more articles you might like to read next: